When I check the log y axes, then a error window pops us and the axis labels of the figure are no displayed correctly. I get all zeros instead of 10^-1, 10^-2 etc. What’s going on?
This is typically the case in the following example. In singledose.mlxplore.mlxtran (in the demo files in Userguide/2_TreatmentDesign/), a PK model is explored using two different treatments. Both treatments start at t=5. The following figure shows the results of the concentration for both treatments.
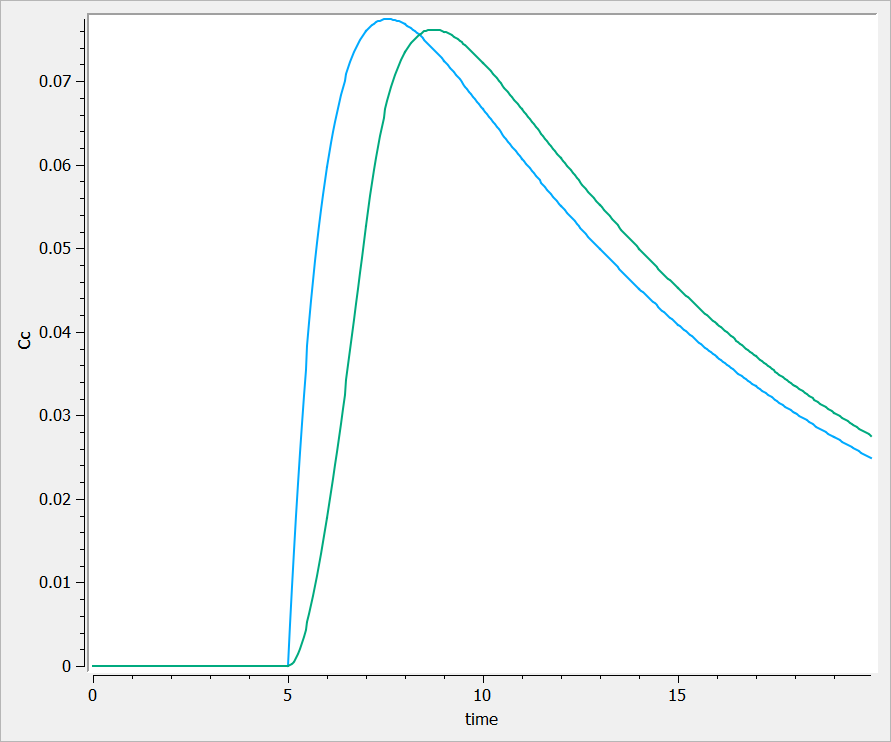
One can see that before t=5, both concentrations are equal to 0.
Clicking on log-scale for the Y-axis.
When clicking on the log-scale for the Y-axis, the following windows pops up explaining that there is an issue in the computation.
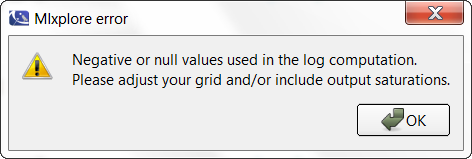
Thus, the proposed graphic provides a poor representation and the axes are not displayed correctly.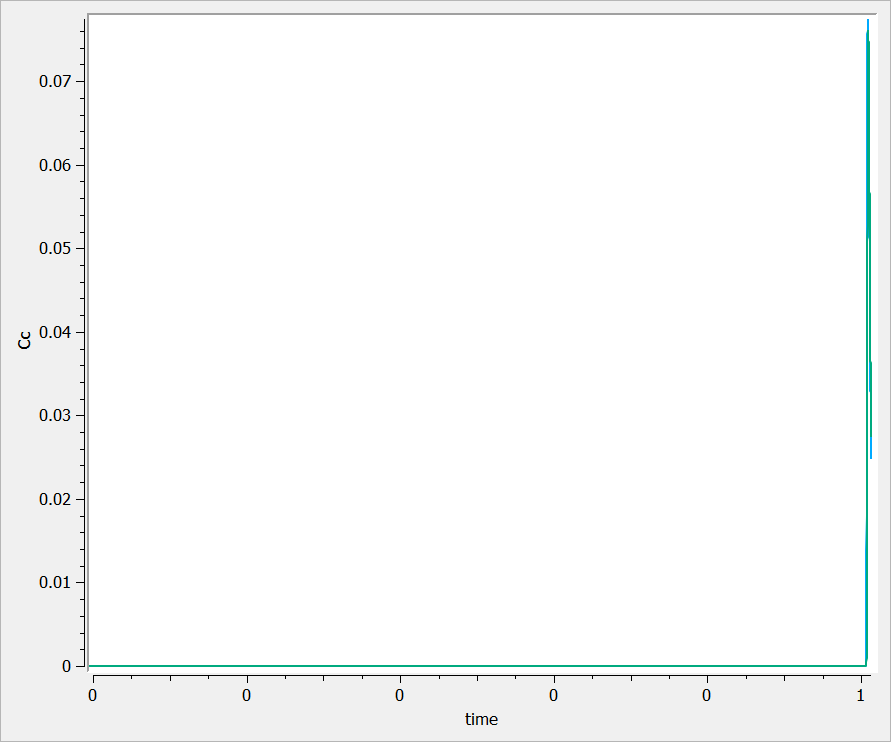
Possibility n°1: Change manually the axis
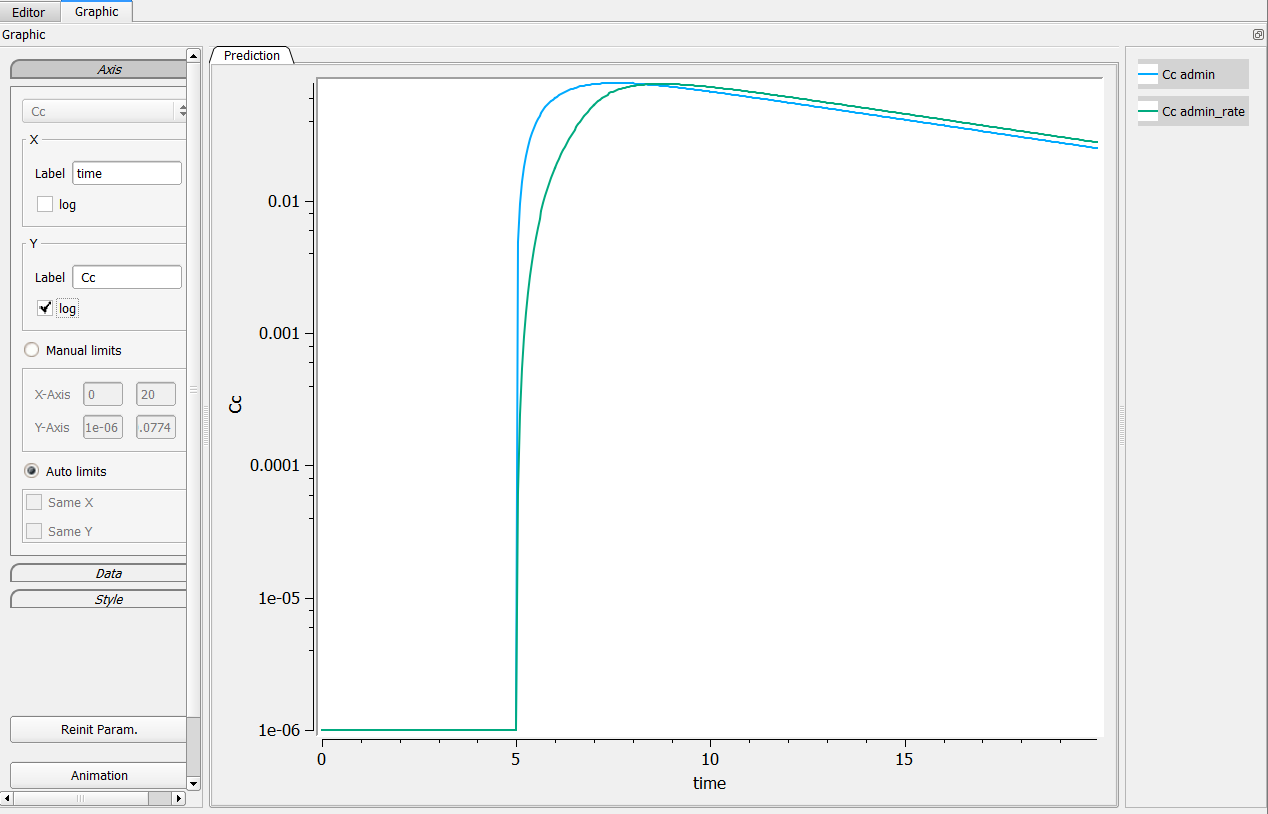
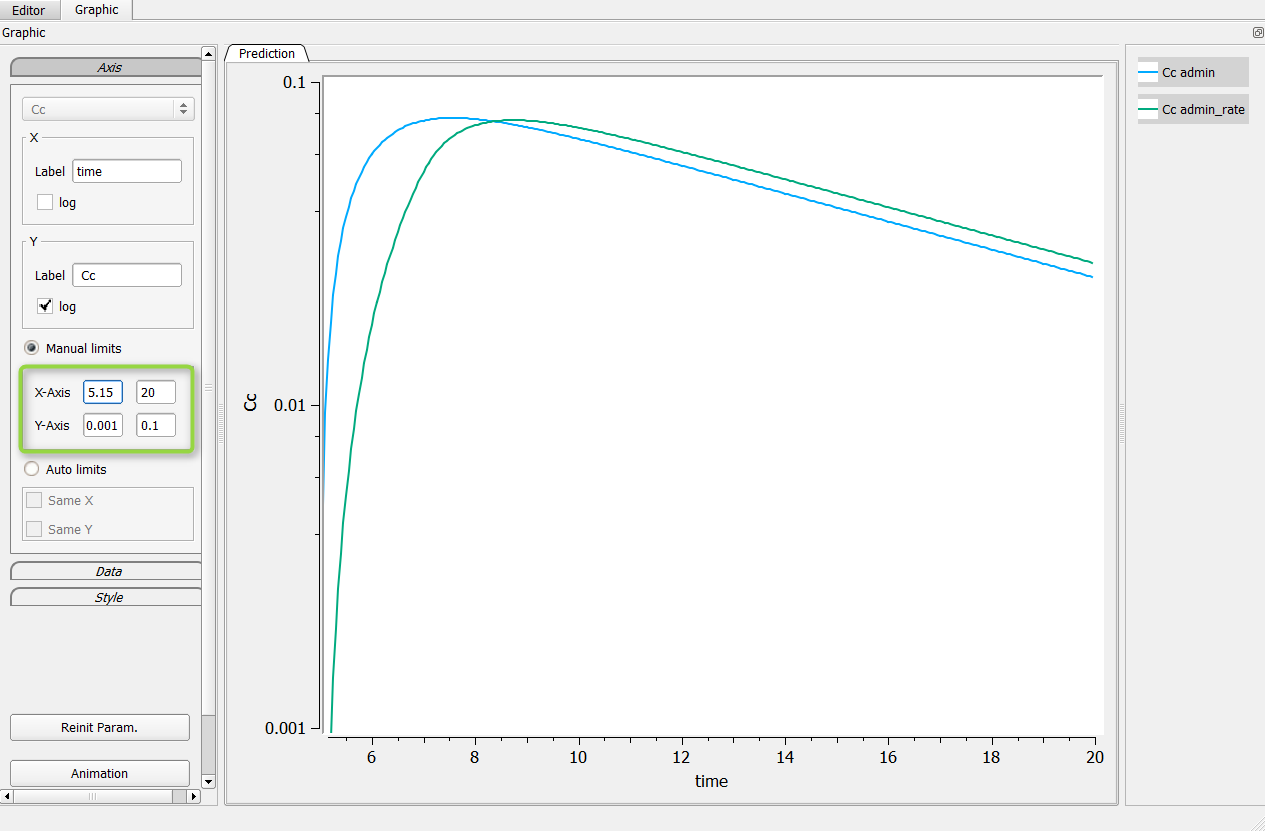
The first possibility is to change manually the axis of your graphic. For that, go in the axis setting, click on “Manual settings” as on the following figure (in the green box). In the presented case, one can set the minimum of the X-axis bigger than 5, and the Y-axis between .001 and .1 for example.
Possibility n°2: Change the grid in the Mlxplore project
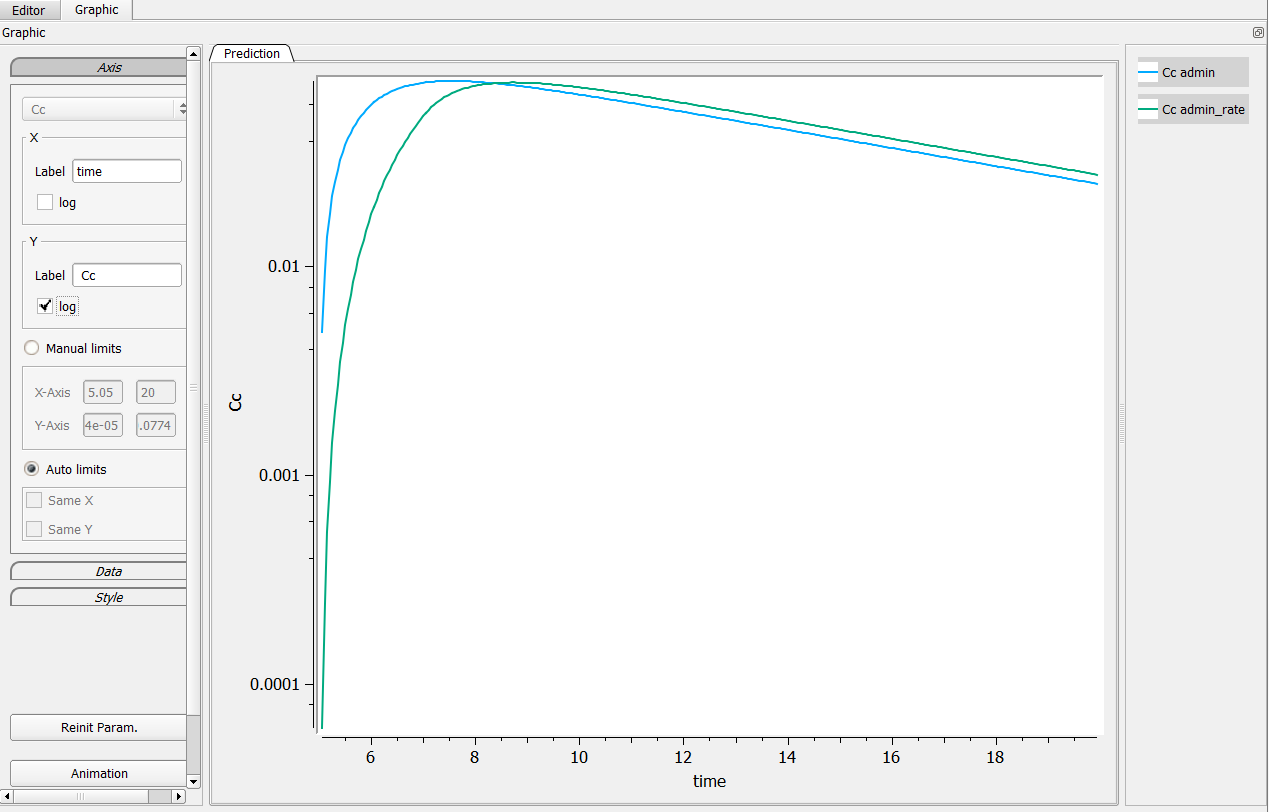
It is possible to change it the grid in the project file via the editor and start it after 5 for example. In the following case, we set
grid = 5.05:.05:20
It leads to the following figure when clicking on the log-scale.
Possibility n°3: Add a saturation on your output
On the longitudinal model, the user can add a saturation function to make sure the concentrations are greater than a strictly positive value. In the following case, we set
Cc = max(Ac/V, 1e-6)
in the model file. It leads to the following figure when clicking on the log-scale.