Introduction
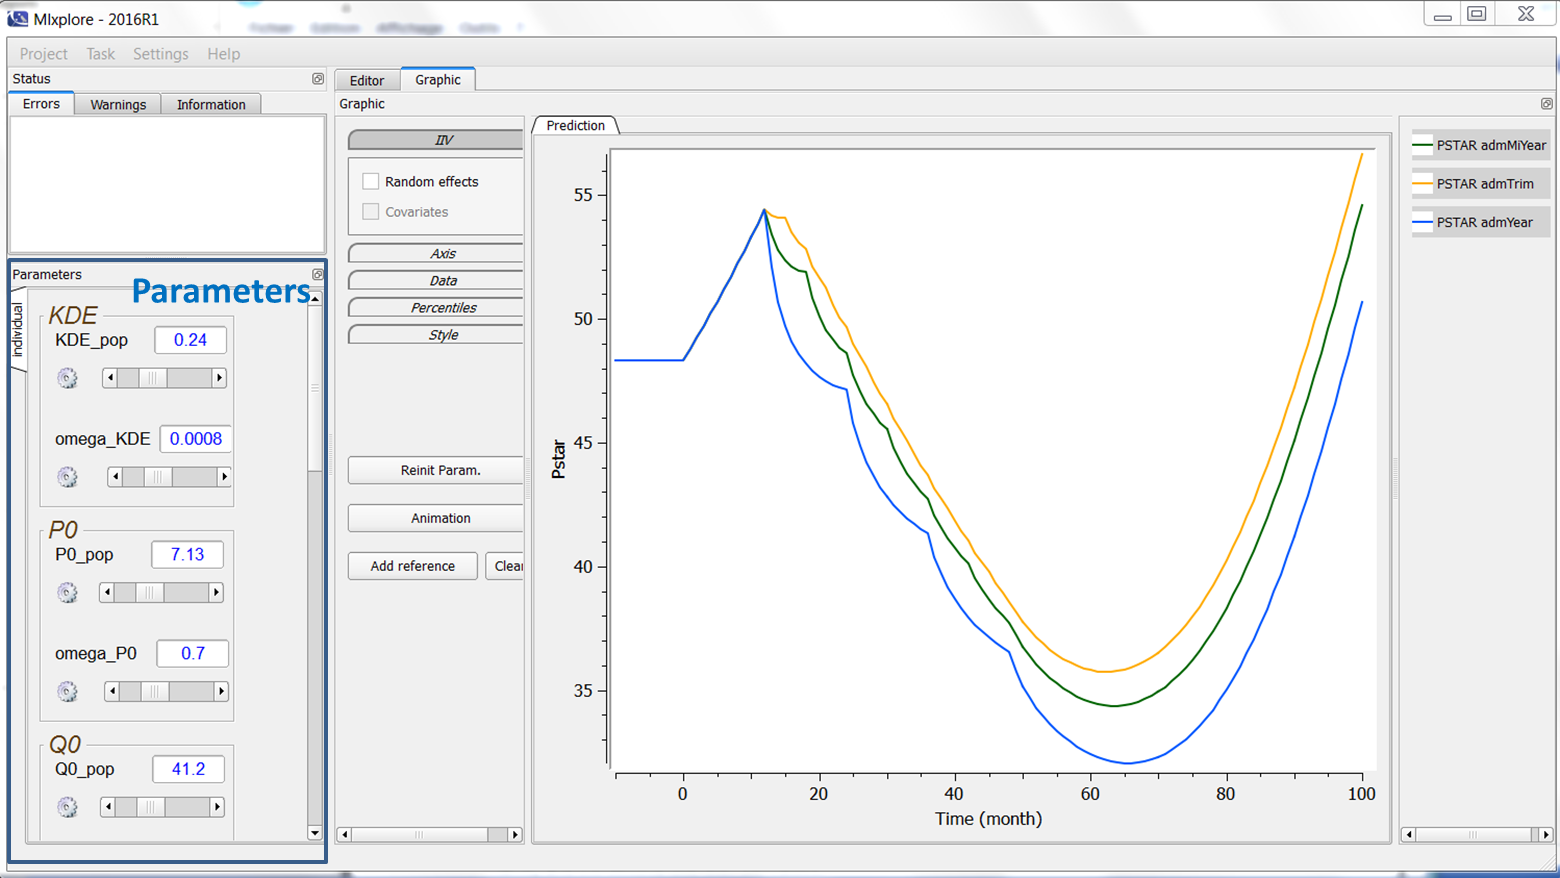
On the left of the interface, we can play with the parameters values. They are represented by their name, their value and a slider as can be seen on the following figure.
What can we do with the parameters?
One can play with the parameters in several ways :
- modify the value by typing a number directly in the numerical box.
- modify the value with the slider. By default, the bounds are half and twice the initial condition of the parameter. This can be modified by clicking on the button on the left where you can define manually the min and the max.
Why is there several parameters windows?
There are several windows corresponding to the several subsections of the model
- “prediction” corresponds to the inputs of the [LONGITUDINAL] subsection. Notice that Mlxplore does not take the error model into account, therefore, only the prediction is used. Thus, if an error model is defined, the slider for the parameter may appear but will have no impact on the prediction results.
- “individual” corresponds to the inputs of the [INDIVIDUAL] subsection. Notice that, when a distribution is defined for a parameter, all the parameters used to define the prediction are displayed in a common box. Moreover, if the distribution is defined with covariates and coefficients, the coefficients are included in the same box.
- “covariate” corresponds to the inputs of the [COVARIATE] subsection. It works exactly as the window individual.
Why are we abusively talking about real time?
When the user modifies a parameter, the computation is instantaneously remade. The user sees directly the results in the graphics frame. For example, when modifying the parameter gamma_pop from 0.729 to .25, a new simulation is run and the graphic is updated as follows:
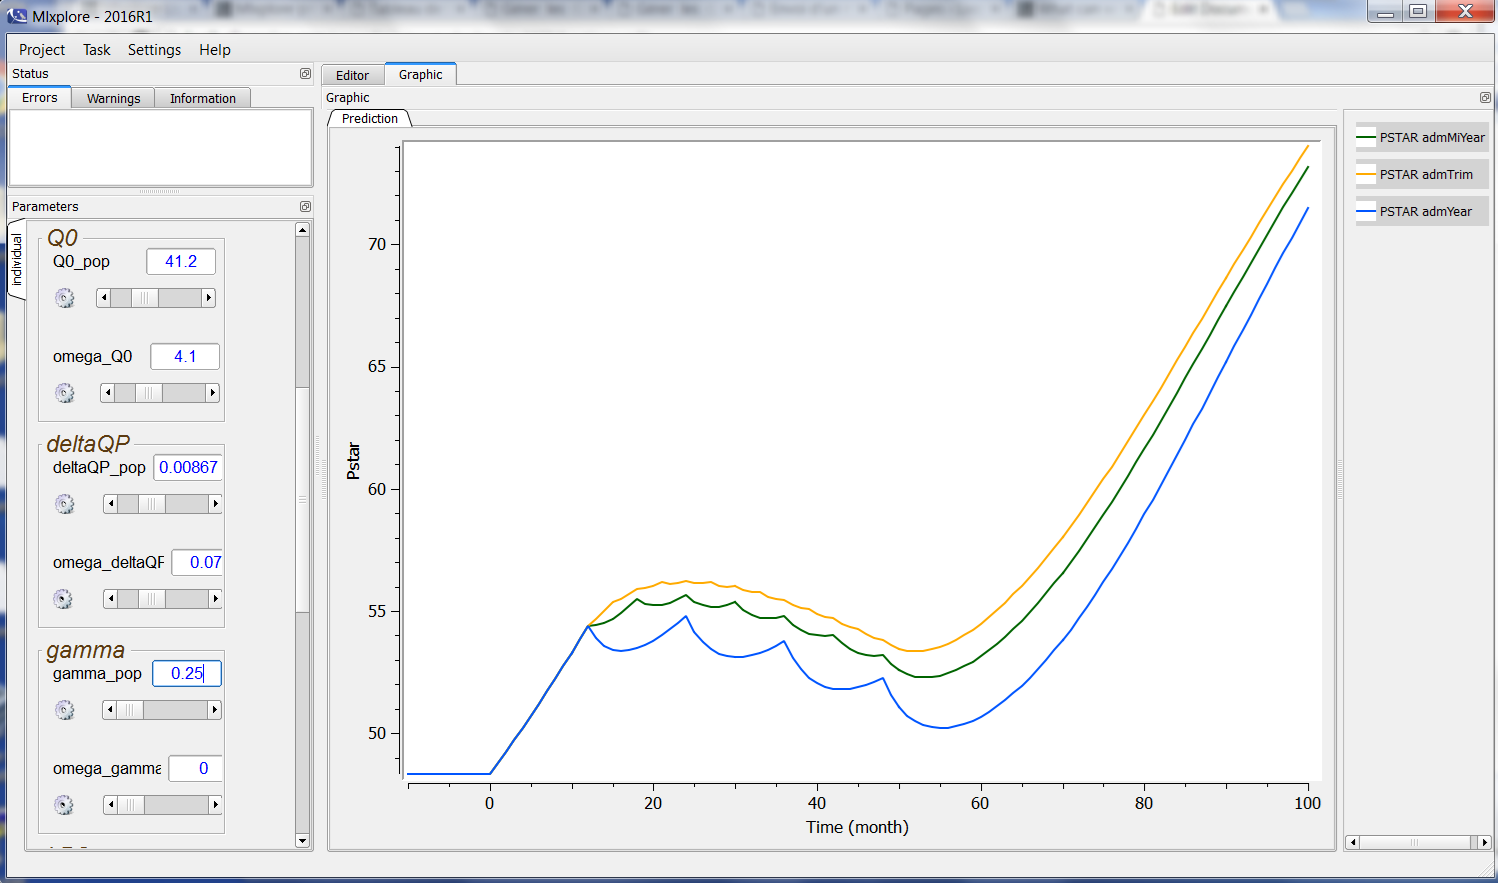
We abusively talk about real time. We do not have any pretension to be real-time. This is just to point out that the computations are fast and made automatically.