Introduction
It is possible to overlay a data set on the graphics using the “Browse” button in the “Data” frame.
Loading a data set
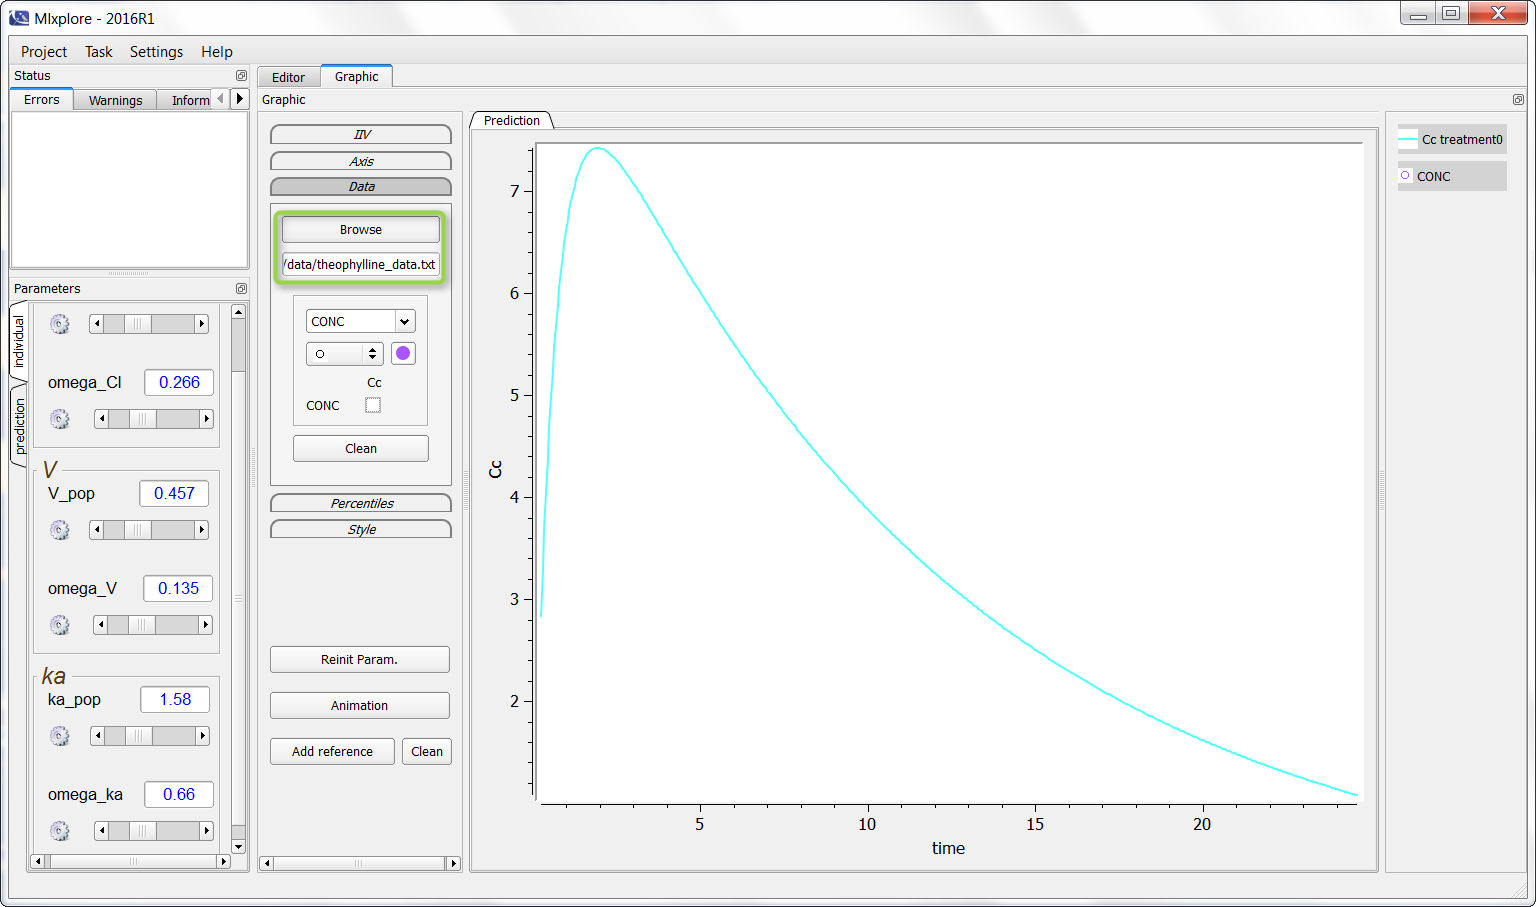
Firstly, it is possible to load a data set. By clicking on “Browse” and choosing a data set, a window appears. The user has to define which column is the time, which one is the measurements and which one is the YTYPE (if necessary).
On the following example, a PK model was used and we would like to add the theophylline data set. One can click on “Browse” and choose the data as following (in the green box):

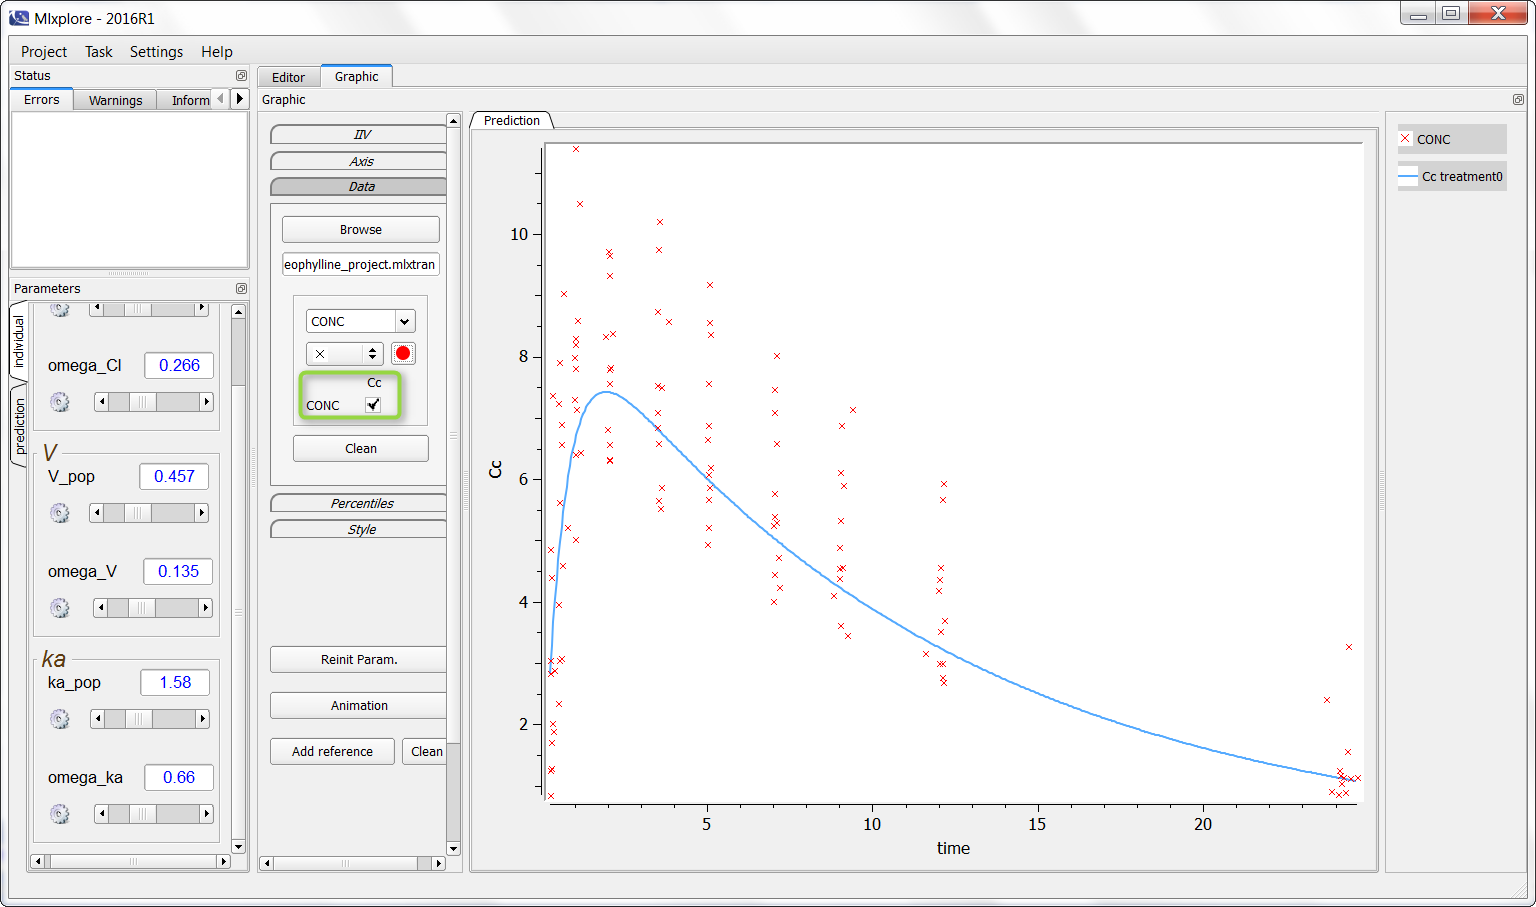
It is now possible to click (as in the green box) to overlay the data on the graphic as following:

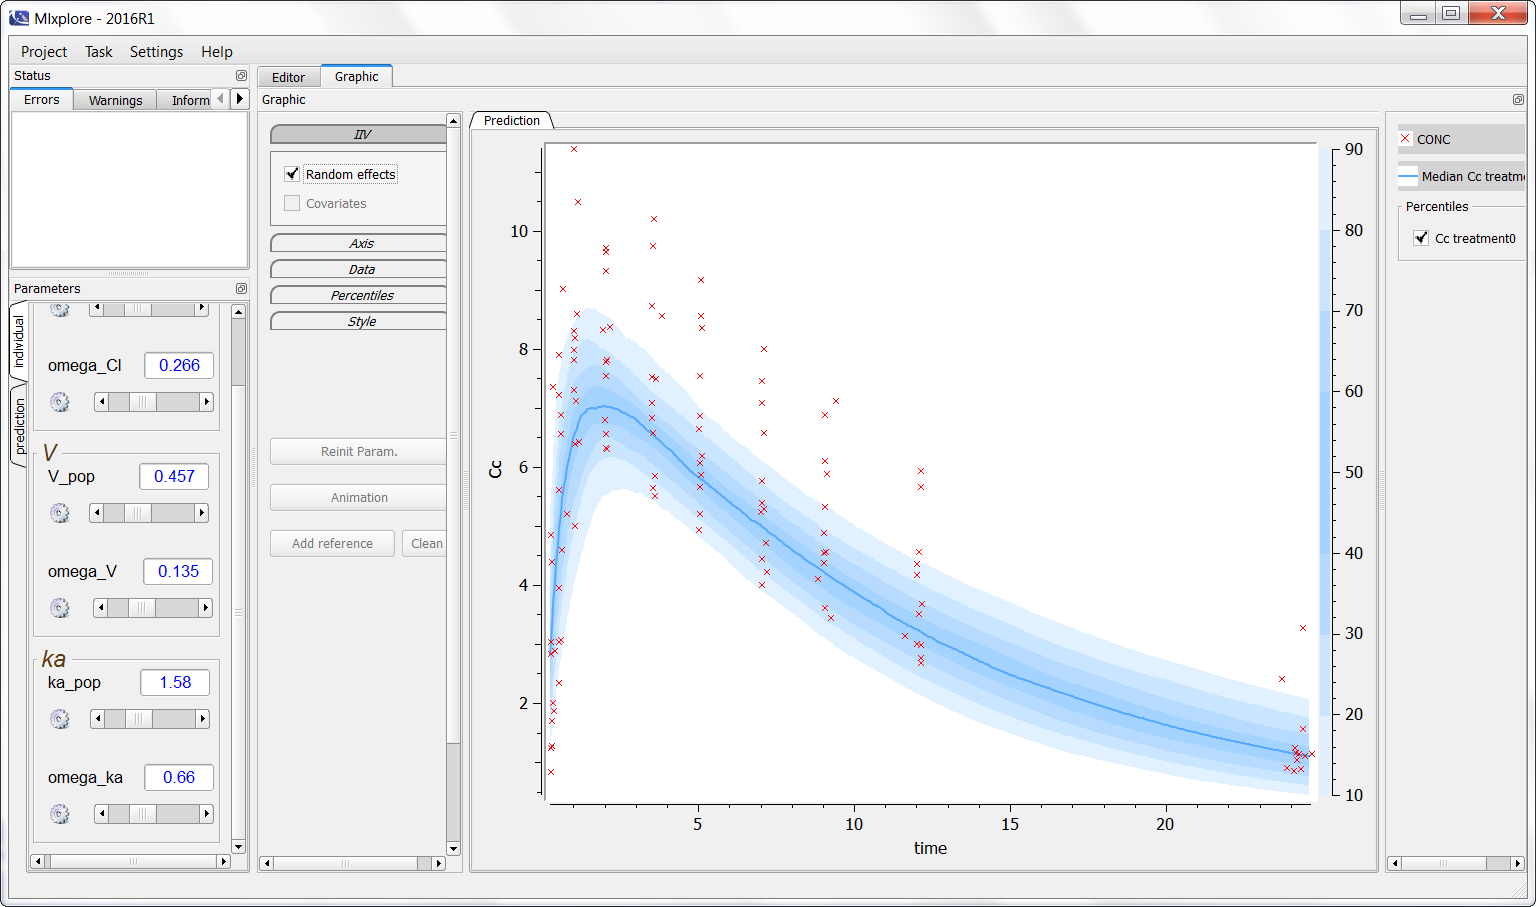
Finally, one can activate the iiv simulations to see the representativity of the model with regards to the data set as on the following figure:

Notice that Mlxplore does not manage error models. Thus, the comparison between the model and the data set is not fully representative of the variability of the model.
Export function from Monolix
When exporting a project from Monolix to Mlxplore, the data set is directly loaded (but not displayed by default) and the parameters taken into account are those from Monolix interface.