The purpose of this case study is to explore the homeostasis of glucose and insulin plasma concentrations after glucose or carbohydrate uptake.
- Introduction
- Physiologically-based glucose-insulin model
- Writing the model in Mlxtran
- Exploration of the effect of glucose tolerance tests
- Conclusion
- Downloads
Introduction
Disregulation of the glucose homeostasis is the cause of diabetes mellitus. To diagnose this disease, glucose and insulin monitoring after glucose uptake are performed during clinical tests, such as the oral glucose tolerance test (OGTT), the intravenous glucose tolerance test (IVGTT) and the mixed-meal glucose tolerance test (MGTT).
To simulate these clinical tests, a physiologically-based glucose-insulin model has been developed for healthy humans in:
We use this model for this case study.
Physiologically-based glucose-insulin model
Plasma glucose levels are tightly regulated by the human body to ensure a constant delivery of this energy source to all tissues. After a meal, the increased glucose supply from the ingested food must be counterbalanced by an uptake of glucose by the liver for storage. On the opposite, during fast, the liver releases glucose. Glucose metabolism is tightly linked to insulin metabolism. Insulin is produced by the pancreatic cells when plasma glucose levels are high to promote glucose uptake by muscles and other organs. Other hormones are also involved in glucose homeostasis: incretins are released in the gut after glucose ingestion and stimulate insulin production. On the other hand, glucagon is produced when glucose levels are low and promotes the release of glucose from the liver.
To capture the human body physiology and the different sites of production and consumption of glucose and insulin a physiologically-based (PB) approach has been undertaken. In a PB model, the main organs are represented by well-stirred compartments connected via blood flow rates. This permits to easily model different kinds of perturbations as there is a close to 1-to-1 mapping between the human body parts and the model. Organ volumes and blood flow rates are well-known fro the human body, while parameters related to the metabolism in the various organs must be estimated from data or literature.
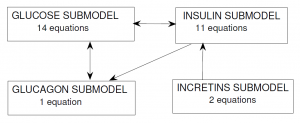
In the Alvehag et al. model, glucose and the three hormones (insulin, incretins and glucagon) were included as inter-connected submodels. The scheme below (from Alvehag et al.) summarizes the number of equations in each submodel and the submodel interconnections. In total, the model encompasses 28 equations, partly non-linear.
Glucose submodel
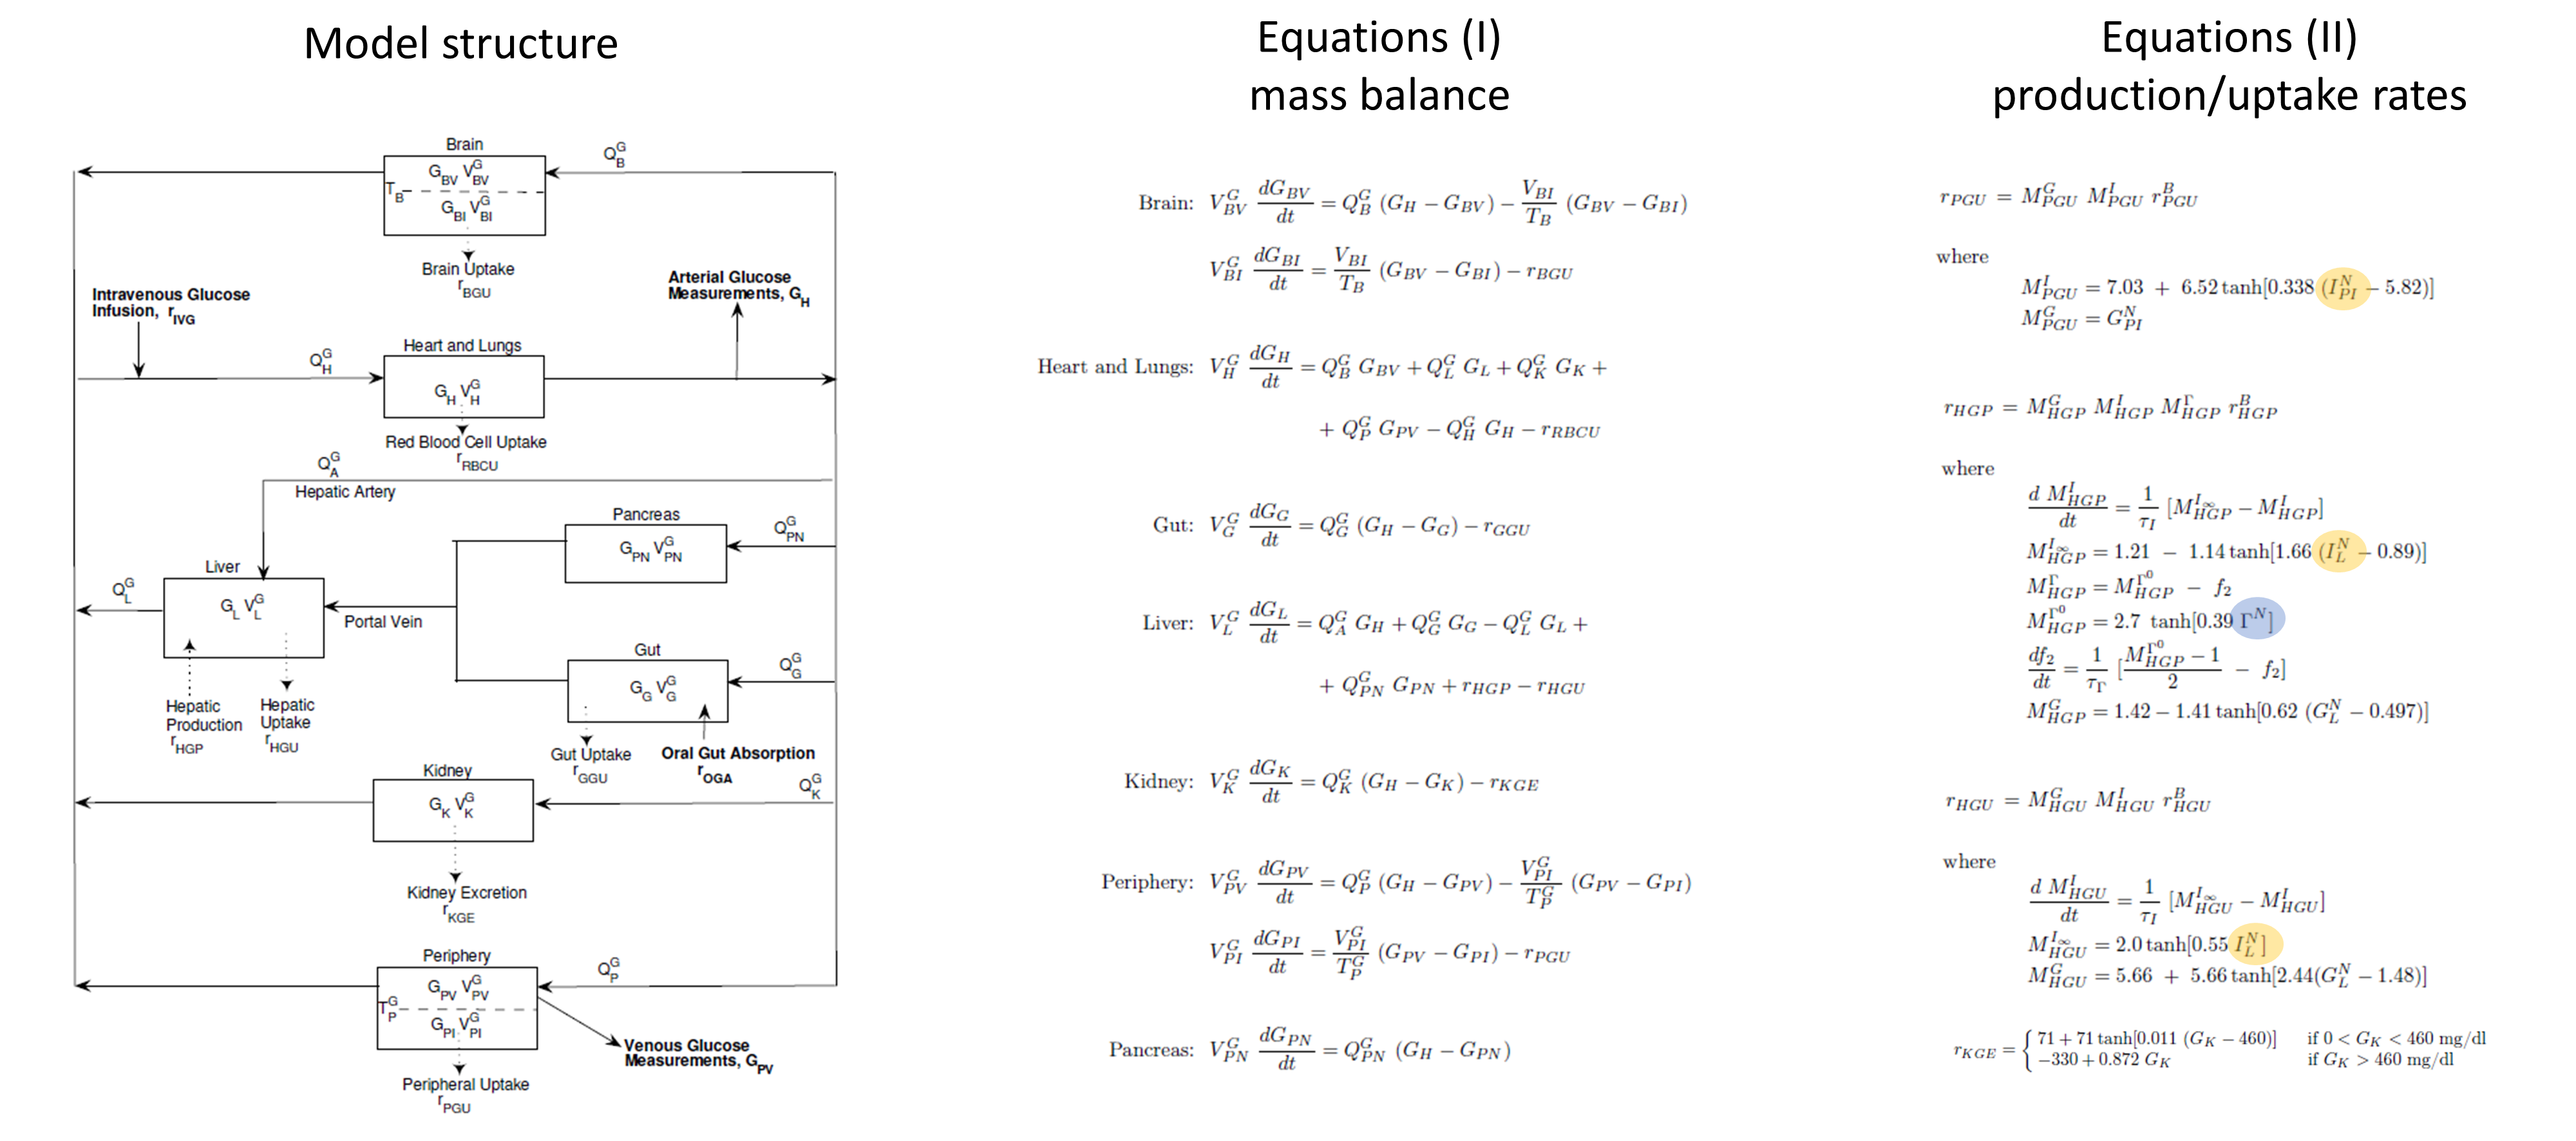
The glucose PB submodel is composed of the main organs involved in glucose metabolism: brain, pancreas, gut, liver, kidney, periphery (such as muscles) and heart and lungs. The scheme below (from Alvehag et al.) gives an overview of the model. The interconnection to the insulin submodel is highlighted in yellow and that to the glucagon model in blue. The details are given in Alvehag et al.
Insulin submodel
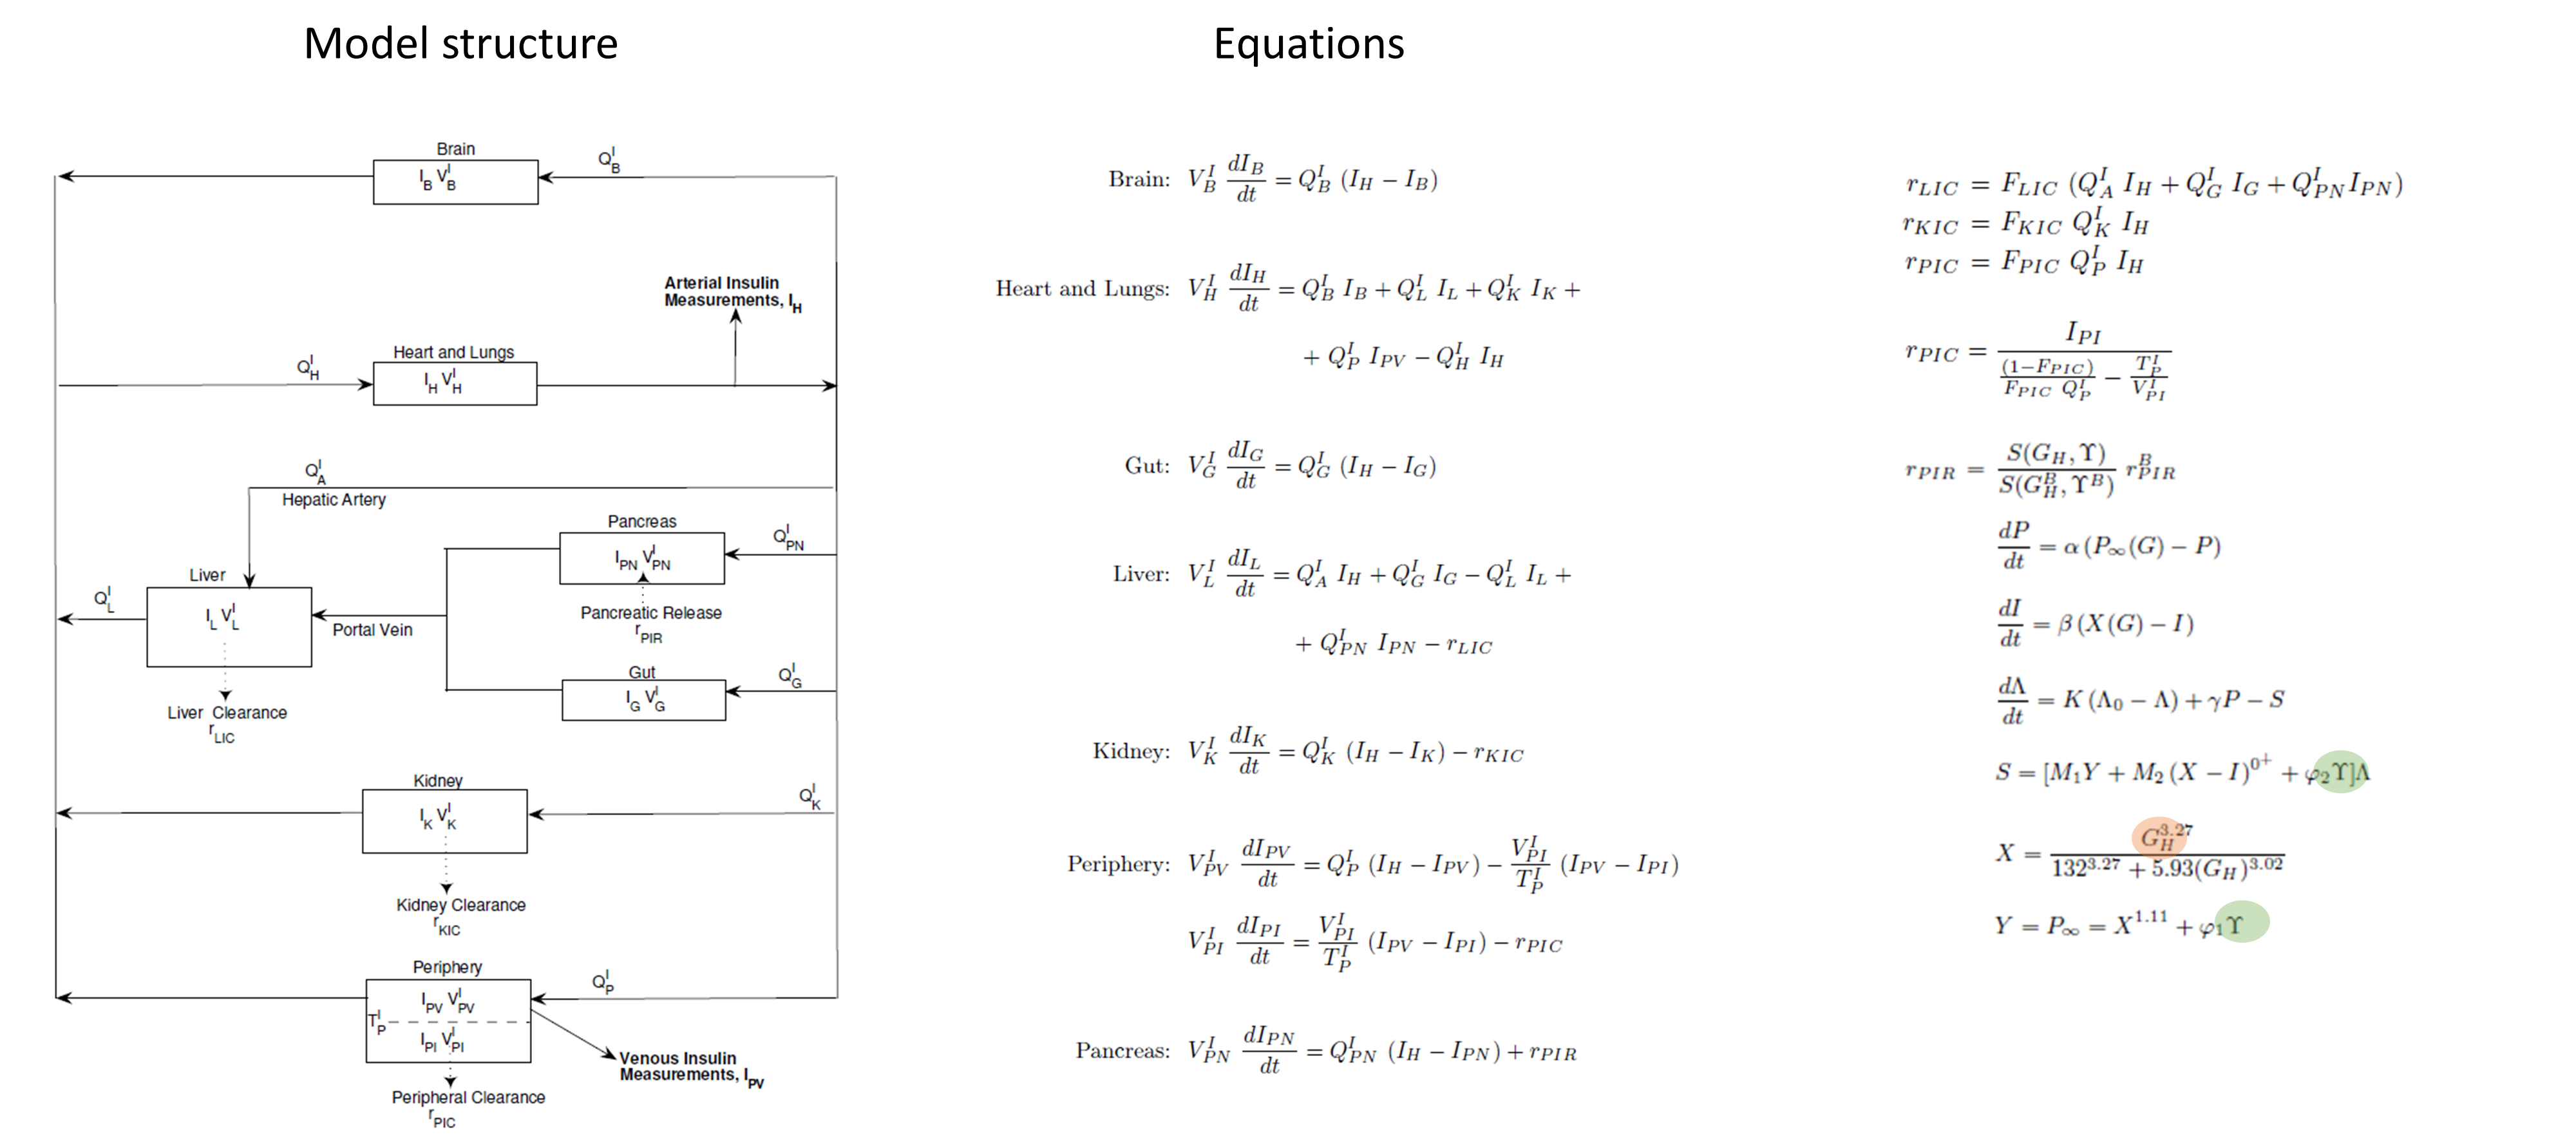
The insulin submodel is composed of the same organs as the glucose submodel. The scheme and equations are given below. The connection to the glucose model is in orange and to the incretins model in green.
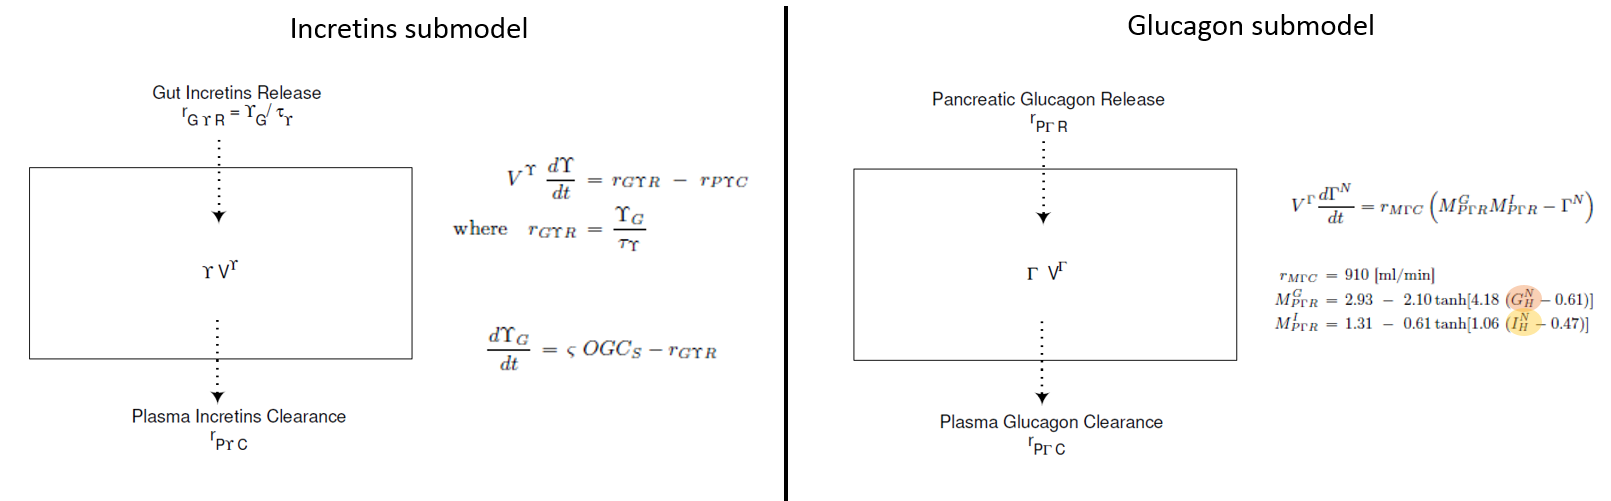
Incretins and glucagon submodels
For glucagon and incretins only one compartment is considered, representing the entire body.
Glucose tolerance tests
The glucose tolerance tests are modeled in the following way:
- intravenous glucose tolerance test (IVGTT): short infusion of glucose, applied directly to the venous glucose concentration
- oral glucose tolerance test (OGTT): rapid first-order absorption with a transit compartment representing the stomach
- mixed-meal glucose tolerance test (MGTT): slow first-order absorption with a transit compartment representing the stomach
How to write it in Mlxtran
The model itself
The model consists of a set of 28 ODEs which will be described in the [LONGITUDINAL] subsection. The model inputs, i.e the parameters that we want to explore, are indicated first. The model contains a large number of parameters, most of them represent organs volumes and blood flows, which value is fixed and not relevant to change. They are directly written in the model. On the opposite the parameters related to the oral absorption of glucose are interesting to explore, as well as the initial steady-state concentrations of glucose and insulin. In addition, we will also add the basal glucose uptake rate by peripheral organs (such as muscles) as parameter, to investigate the effect of physical exercise. We thus write:
[LONGITUDINAL]
input={abs_time, time_glu, time_meal, basal_glu, basal_ins, glu_uptake}
with the following definitions:
- abs_time = characteristic time of transfer of glucose from intestine to blood
- time_glu = characteristic time of transfer from stomach to intestine, in case of glucose ingestion
- time_meal = characteristic time of transfer from stomach to intestine in case of glucose-containing meal
- basal_glu = steady-state plasma glucose concentration
- basal_ins = steady-state plasma insulin concentration
- glu_uptake = basal rate of glucose uptake by periphery organs such as muscles
In the PK: block, we define which entities will receive the glucose inputs via the depot macro. The three tolerance tests will be modeled by three different administration, each having an identifier adm. For the IVGTT, the identifier is 1 (adm=1) and the glucose amount injected is added on the amount of glucose in the blood AGH (target=AGH). For the OGTT and MGTT, the glucose ingested in added to the amount of glucose in the stomach Gs2 and Gs3. In addition, the rate of ingested glucose triggers the production of incretins in the gut (IncG) at a rate 0.9% slower than glucose uptake rate. This is captured with the p= parameter.
PK:
depot(adm=1,target=AGH)
depot(adm=2,target=Gs2)
depot(adm=2,target=IncG, p=0.009)
depot(adm=3,target=Gs3)
depot(adm=3,target=IncG, p=0.009)
In the following EQUATION: block, the fixed parameter values and ODEs are defined. For instance for the amount of glucose in the heart, we write:
t_0 = 0 ; time initialization
AGH_0=GH0*VGH ; initial amount of glucose in heart [mg]
ddt_AGH=QGB*GBV + QGL*GL + QGK*GK + QGP*GPV - QGH*GH - rRBCU
In addition to simulating a typical individual, one may consider inter-individual variability in the model parameters and its influence of the predicted glucose and insulin concentration. In this case study, we will restrict ourselves to inter-individual on the basal glucose and insulin levels, but inter-individual variability can be considered on all parameters in a similar way.
To define the inter-individual variability, we add a section [INDIVIDUAL], which describes the distribution of the basal plasma glucose concentration within the population:
[INDIVIDUAL]
input={Glu_pop, omega_Glu, Ins_pop, omega_Ins}

DEFINITION:
basal_glu = {distribution = lognormal, typical = Glu_pop, sd = omega_Glu}
basal_ins = {distribution = lognormal, typical = Ins_pop, sd = omega_Ins}
The inputs are the population parameters Glu_pop, omega_Glu, Ins_pop and omega_Ins. The output are the individual parameters basal_glu and basal_ins, which are then used as input of the [LONGITUDINAL] section.
The code for the full model is given in the file glucose_insulin_model.txt
Click here to see the full model
[LONGITUDINAL]
input={ta, tge2, tge3, GPV0, IPV0, rBPGU}

PK:
depot(adm=1,target=AGH)
depot(adm=2,target=Gs2)
depot(adm=2,target=IncG, p=0.009)
depot(adm=3,target=Gs3)
depot(adm=3,target=IncG, p=0.009)

EQUATION:
odeType=stiff

; =================== fixed parameter values =======================================

; ==== insulin submodel =======================
; organ (compartment) volumes
VIB=0.265 ; volume of brain for insulin submodel [L]
VIL=1.07 ; volume of liver for insulin submodel [L]
VIG=0.945 ; volume of gut for insulin submodel [L]
VIK=0.505 ; volume of kidney for insulin submodel [L]
VIH=0.985 ; volume of heart for insulin submodel [L]
VIPV=0.735 ; volume of peripheral venous blood for insulin submodel [L]
VIPI=6.3 ; volume of peripheral interstitial fluid for insulin submodel [L]
VIPN=0.07 ; volume of heart for insulin submodel [L]

; blood flow between organs (compartments)
QIB=0.45 ; blood flow through brain for insulin submodel [L/min]
QIH=3.12 ; blood flow through heart for insulin submodel [L/min] = sum of QIB + QIL + QIK + QIP
QIA=0.18 ; blood flow in hepatic artery for insulin submodel [L/min]
QIL=0.9 ; blood flow through liver for insulin submodel [L/min] = sum of QIA + QIG + QIPN
QIG=0.684 ; blood flow through gut for insulin submodel [L/min]
QIK=0.72 ; blood flow through kidney for insulin submodel [L/min]
QIP=1.05 ; blood flow through peripheral tissues for insulin submodel [L/min]
QIPN=0.036 ; blood flow through pancreas for insulin submodel [L/min]

; diffusion parameters
TIP=20 ; transcapillary diffusion time constant for insulin in peripheral tissues [min]

; fractional clearances
FPIC=0.15 ; fractional clearance by [dimensionless]
FLIC=0.40 ; fractional clearance by liver [dimensionless]
FKIC=0.30 ; fractional clearance by kidney [dimensionless]

; parameters related to insulin secretion in pancreas
M1=0.007968 ; [/min]
M2=0.136495 ; [/min]
alpha=0.048229 ; [/min]
beta=0.93141 ; [/min]
K=0.0079378 ; [/min]
phi1=0.003 ; [L/pmol]
phi2=0.0001 ; [L/pmol min]
gam=0.57493 ; [U/min]
lmb0=6.3294 ; [U]

; ==== glucose submodel ==================
; organ (compartment) volumes
VGBV=3.5 ; volume of brain vascular blood for glucose submodel [dL]
VGBI=4.5 ; volume of brain interstitial fluid for glucose submodel [dL]
VGH=13.8 ; volume of heart for glucose submodel [dL]
VGL=23.5 ; volume of liver for glucose submodel [dL]
VGG=11.2 ; volume of gut for glucose submodel [dL]
VGK=6.6 ; volume of kidney for glucose submodel [dL]
VGPV=10.4 ; volume of periphery blood for glucose submodel [dL]
VGPI=6.3 ; volume of periphery intertitial fluid for glucose submodel [dL]
VGPN=1.6 ; volume of pancreas for glucose submodel [dL]

; blood flow between organs (compartments)
QGB=5.9 ; blood flow through brain for glucose submodel [dL/min]
QGH=43.7 ; blood flow through brain for glucose submodel [dL/min]
QGA=2.5 ; blood flow through brain for glucose submodel [dL/min]
QGL=12.6 ; blood flow through brain for glucose submodel [dL/min]
QGG=9.6 ; blood flow through brain for glucose submodel [dL/min]
QGK=10.1 ; blood flow through brain for glucose submodel [dL/min]
QGP=15.1 ; blood flow through brain for glucose submodel [dL/min]
QGPN=0.5 ; blood flow through brain for glucose submodel [dL/min]

; diffusion parameters
TB=2.1 ; transcapillary diffusion time constant for glucose in brain [min]
TGP=5.0 ; transcapillary diffusion time constant for glucose in peripheral tissues [min]

; sink parameters for glucose
rBGU=70 ; brain glucose uptake [mg/min]
rRBCU=10 ; red blood cell glucose uptake [mg/min]
rGGU=20 ; gut glucose uptake [mg/min]
;rBPGU= ; basal peripheral glucose uptake [mg/min] INPUT PARAMETER
rBHGP=155 ; basal hepatic glucose production [mg/min]
rBHGU=20 ; basal hepatic glucose uptake [mg/min]
TauI=25 ; typical time for hepatic glucose production and uptake [min]
TauGamma=65 ; related to effect of glucagon on hepatic glucose production [min]

; ==== incretins submodel ==================
VInc=9.930 ; volume of whole-body compartment [L]
rMIncC=0.14 ; metabolic incretins clearance [L/min]
TauInc=25 ;time delay constant describing the process when incretins are absorbed from the gut into the blood [min]
sigma=0.009 ; [pmol/mg]

; ==== glucagon submodel ==================
VGamma=9930 ; volume for whole-body compartment [mL]
rMGammaC=910 ; glucagon clearance [mL/min]

; ========definition of variables belonging to several submodels =====================================

; ==== insulin submodel =======================
; calculation of insulin concentrations from amounts and volumes
IH=AIH/VIH ; insulin concentration in heart [mU/L]
IB=AIB/VIB ; insulin concentration in brain [mU/L]
IL=AIL/VIL ; insulin concentration in liver [mU/L]
IG=AIG/VIG ; insulin concentration in gut [mU/L]
IK=AIK/VIK ; insulin concentration in kidney [mU/L]
IPV=AIPV/VIPV ; insulin concentration in peripheral tissue blood [mU/L]
IPI=AIPI/VIPI ; insulin concentration in peripheral interstitial fluid [mU/L]
IPN=AIPN/VIPN ; insulin concentration in pancreas [mU/L]

; initialization for insulin concentrations
;IPV0 = _IPV0 ; initial concentration of insulin in pheriphery blood [mU/L] INPUT PARAMETER
IH0=IPV0/(1-FPIC) ; initial concentration of insulin in heart [mU/L]
IB0=IH0 ; initial concentration of insulin in brain [mU/L]
IL0=(IH0/QIL)*(QIH-QIP*(1-FPIC)-QIK*(1-FKIC)-QIB) ; initial concentration of insulin in liver [mU/L]
IG0=IH0 ; initial concentration of insulin in gut [mU/L]
IK0=IH0*(1-FKIC) ; initial concentration of insulin in kidney [mU/L]
IPI0=(1-(TIP*FPIC*QIP)/(VIPI*(1-FPIC)))*IPV0 ; initial concentration of insulin in periphery interstitial fluid [mU/L]
IPN0=(IH0/QIPN)*(QIH/(1-FLIC)-QIA-QIG-(1-FPIC)/(1-FLIC)*QIP-QIB/(1-FLIC)-QIK*(1-FKIC)/(1-FLIC)) ; initial concentration of insulin in pancreas [mU/L]

; ==== glucose submodel ==================
; calculation of glucose concentrations from amounts and volumes
GH=AGH/VGH ; glucose concentration in heart [mg/dL]
GBV=AGBV/VGBV ; glucose concentration in vascular blood in brain [mg/dL]
GBI=AGBI/VGBI ; glucose concentration in interstitial fluid in brain [mg/dL]
GG=AGG/VGG ; glucose concentration in gut [mg/dL]
GPN=AGPN/VGPN ; glucose concentration in pancreas [mg/dL]
GL=AGL/VGL ; glucose concentration in liver [mg/dL]
GK=AGK/VGK ; glucose concentration in kidney [mg/dL]
GPV=AGPV/VGPV ; glucose concentration in peripheral tissue blood [mg/dL]
GPI=AGPI/VGPI ; glucose concentration in peripheral tissue interstitial fluid [mg/dL]

; initialization of glucose concentrations
;GPV0= _GPV0 ; initial concentration of glucose in periphery blood [mg/dL] => INPUT PARAMETER
GH0=GPV0+rBPGU/QGP ; initial concentration of glucose in heart [mg/dL]
GBV0=GH0-rBGU/QGB ; initial concentration of glucose in brain blood [mg/dL]
GBI0=GBV0-rBGU*TB/VGBI ; initial concentration of glucose in brain interstitial fluid [mg/dL]
GG0=(GH0-rGGU/QGG) ; initial concentration of glucose in gut [mg/dL]
GPN0=GH0 ; initial concentration of glucose in pancreas [mg/dL]
GL0=(1/QGL)*(QGA*GH0+QGG*GG0+QGPN*GPN0+rBHGP-rBHGU) ; initial concentration of glucose in liver [mg/dL]
GK0=GH0 ; initial concentration of glucose in kidney [mg/dL]
GPI0=GPV0-rBPGU*TGP/VGPI ; initial concentration of glucose in periphery interstitial fluid [mg/dL]

; ==== incretins submodel ==================
; calculation of incretin concentration from amount and volume
Inc=AInc/VInc

; ==== glucagon submodel ==================
; calculation of glucagon concentration from amount and volume
GammaN=AGammaN/VGamma


; =================== ODEs ===================================================================================

; initialization of the time
t_0 = 0


; ==== gastric absorption submodel ==================

; amount of glucose in the stomach when oral glucose [mg]
ddt_Gs2=-Gs2/tge2
; rate of glucose absorption into blood when oral glucose [mg/min]
ddt_rOGA2=-(rOGA2/ta)+Gs2/(ta*tge2)
; amount of glucose in the stomach for oral meal [mg]
ddt_Gs3=-Gs3/tge3
; rate of glucose absorption into blood when oral meal [mg/min]
ddt_rOGA3=-(rOGA3/ta)+Gs3/(ta*tge3)

; ==== insulin submodel ==================

; initialization of insulin amounts (ODEs variables)
AIH_0=IH0*VIH ; initial amount of insulin in heart [mU]
AIB_0=IB0*VIB ; initial amount of insulin in brain [mU]
AIL_0=IL0*VIL ; initial amount of insulin in liver [mU]
AIG_0=IG0*VIG ; initial amount of insulin in gut [mU]
AIK_0=IK0*VIK ; initial amount of insulin in kidney [mU]
AIPV_0=IPV0*VIPV ; initial amount of insulin in peripheral tissue blood [mU]
AIPI_0=IPI0*VIPI ; initial amount of insulin in peripheral interstitial fluid [mU]
AIPN_0=IPN0*VIPN ; initial amount of insulin in pancreas [mU]

; calculation of insulin sources and sinks
rLIC = FLIC*(QIA*IH+QIG*IG+QIPN*IPN) ; insulin clearance in liver [mU/min]
rKIC = FKIC*QIK*IH ; insulin clearance in kidney [mU/min]
rPIC = IPI/((1-FPIC)/(FPIC*QIP)-TIP/VIPI) ; insulin clearance in periphery [mU/min]

; caculation of pancretic insulin production (depends on glucose in heart GH and incretins Inc)
rBPIR=IH0*(QIH/(1-FLIC)-QIA-QIG-(1-FPIC)/(1-FLIC)*QIP-QIB/(1-FLIC)-QIPN-QIK*(1-FKIC)/(1-FLIC)) ; basal release [mU/min]
X=GH^(3.267)/(131.87^(3.267)+5.932*(GH^(3.024))) ; early effect
Y=X^(1.1141)+phi1*Inc ; late effect
x0=GH0^(3.267)/(131.87^(3.267)+5.932*(GH0^(3.024))) ; inhibitor initial
y0=x0^(1.1141) ; potentiator initial
I_0=x0 ; inhibitor initial
PP_0=y0 ; potentiator initial
ddt_PP=alpha*(Y-PP) ; potentiator
ddt_I=beta*(X-I) ; inhibitor
Qi=(K*lmb0+gam*y0)/(M1*y0+K) ; initial labile insulin
lmb_0=Qi
ddt_lmb=K*(lmb0-lmb)+gam*PP-(M1*Y+M2*max(0,X-I)+phi2*Inc)*lmb ; labile insulin
S=(M1*Y+M2*max(0,X-I)+phi2*Inc)*lmb
SBGH=(M1*y0)*Qi
rPIR=(S/SBGH)*rBPIR

; insulin ODEs
ddt_AIH=QIB*IB + QIL*IL + QIK*IK + QIP*IPV - QIH*IH ; amount of insulin in heart compartment
ddt_AIB=QIB*(IH-IB) ; amount of insulin in brain compartment
ddt_AIL=QIA*IH + QIG*IG - QIL*IL + QIPN*IPN - rLIC ; amount of insulin in liver compartment
ddt_AIG=QIG*(IH-IG) ; amount of insulin in gut compartment
ddt_AIK=QIK*(IH-IK) - rKIC ; amount of insulin in kidney compartment
ddt_AIPV=QIP*(IH-IPV) - (VIPI/TIP)*(IPV-IPI) ; amount of insulin in periphery blood compartment
ddt_AIPI=(VIPI/TIP)*(IPV-IPI) - rPIC ; amount of insulin in periphery interstitial fluid compartment
ddt_AIPN=QIPN*(IH-IPN) + rPIR ; amount of insulin in the pancreas

; ==== glucose submodel ==================

; initialization of glucose amounts (ODE variable)
AGH_0=GH0*VGH ; initial amount of glucose in heart [mg]
AGBV_0=GBV0*VGBV ; initial amount of glucose in brain blood [mg]
AGBI_0=GBI0*VGBI ; initial amount of glucose in brain interstitial fluid [mg]
AGG_0=GG0*VGG ; initial amount of glucose in gut [mg]
AGPN_0=GPN0*VGPN ; initial amount of glucose in pancreas [mg]
AGL_0=GL0*VGL ; initial amount of glucose in liver [mg]
AGK_0=GK0*VGK ; initial amount of glucose in kidney [mg]
AGPV_0=GPV0*VGPV ; initial amount of glucose in periphery blood [mg]
AGPI_0=GPI0*VGPI ; initial amount of glucose in periphery interstitial fluid [mg]

; calculation of sink and sources
; rKGE = kidney glucose excretion [mg/min]
if GK<0
rKGE=0
elseif GK<460
rKGE=71+71*tanh(0.011*(GK-460))
else
rKGE=-330+0.872*GK
end
; rPGU = peripheral glucose uptake [mg/min]
MGPGU=GPI/GPI0
MIPGU=7.035+6.51623*tanh(0.33827*((IPI/IPI0)-5.82113))
rPGU=MGPGU*rBPGU*MIPGU
 ; rHGP = hepatic glucose production [mg/min]
MGHGP=1.425-1.406*tanh(0.6199*(GL/GL0-0.4969))
MIinfHGP=1.2088-1.138*tanh(1.669*(IL/IL0-0.8885))
MIHGP_0=1
ddt_MIHGP=(MIinfHGP-MIHGP)/TauI
MGamma0HGP=2.7*tanh(0.388*GammaN)
MGammaHGP=MGamma0HGP-f
f_0=0
ddt_f=((MGamma0HGP-1)/2-f)/TauGamma
rHGP=MGHGP*MIHGP*MGammaHGP*rBHGP
; rHGU = hepatic glucose uptake [mg/min]
MGHGU=5.6648+5.6589*tanh(2.4375*((GL/GL0)-1.48))
MIinfHGU=2.0*tanh(0.549*IL/IL0)
MIHGU_0=1
ddt_MIHGU=(MIinfHGU-MIHGU)/TauI
rHGU=MGHGU*MIHGU*rBHGU

; ODEs for glucose
ddt_AGH=QGB*GBV + QGL*GL + QGK*GK + QGP*GPV - QGH*GH - rRBCU ; amount of glucose in heart
ddt_AGBV=QGB*(GH-GBV) - (VGBI/TB)*(GBV-GBI) ; amount of glucose in brain blood
ddt_AGBI=(VGBI/TB)*(GBV-GBI) - rBGU ; amount of glucose in brain interstitial fluid
ddt_AGG=rOGA3 + rOGA2 + QGG*(GH-GG) - rGGU ; amount of glucose in gut
ddt_AGPN=QGPN*(GH-GPN) ; amount of glucose in pancreas
ddt_AGK=QGK*(GH-GK) - rKGE ; amount of glucose in kidney
ddt_AGPV=QGP*(GH-GPV) - (VGPI/TGP)*(GPV-GPI) ; amount of glucose in periphery blood
ddt_AGPI=(VGPI/TGP)*(GPV-GPI) - rPGU ; amount of glucose in periphery interstitial fluid
ddt_AGL=QGA*GH + QGG*GG - QGL*GL + QGPN*GPN + rHGP - rHGU ; amount of glucose on the liver

; ==== incretins submodel ==================

; initial amounts of incretins
IncG_0=0 ; initial concentration of incretin in gut
AInc_0=0 ; initial amount of incretin in whole-body compartment

; ODEs
ddt_IncG=-IncG/TauInc ; incretin concentration in gut
ddt_AInc=IncG/TauInc-rMIncC*Inc ; incretin amount in whole-body compartment

; ==== glucagon submodel ===================

; calculation of sinks and sources
MG=2.93-2.10*tanh(4.18*(GH/GH0-0.61))
MI=1.31-0.61*tanh(1.06*(IH/IH0-0.47))

; initialization
AGammaN_0=VGamma

; ODEs
ddt_AGammaN=rMGammaC*(MG*MI - AGammaN/VGamma)

; ==== calculation of output ==========================================================================================

; calculation of output values
venous_plasma_glucose = GPV
venous_plasma_insulin = IPV
arterial_plasma_glucose = GH
arterial_plasma_insulin = IH
Project definition
To define the project, we must define the model (via the path to the model file, given in the <MODEL> section), a typical value for the input parameters values (in the <PARAMETER> section) and output to display (name and time grid, in the <OUTPUT> section) and the administrations corresponding to the three glucose tolerance tests that we would like to simulate (in the <DESIGN> section).
In the [ADMINISTRATION] subsection of the <DESIGN> section, the three glucose administrations corresponding to the three tolerance tests are defined, via the time of administration (time=), amount of glucose administered (amount=), duration of the infusion (tinf=) and administration identifier (adm=) for the link with the depot macros described above.
The full project file reads:
<MODEL>
file = './glucose_insulin_model.txt'

<PARAMETER>
abs_time = 22
time_glu = 73
time_meal = 156
Glu_pop = 89
omega_Glu = 0.2
Ins_pop = 13
omega_Ins = 0.1

<OUTPUT>
list={venous_plasma_glucose, venous_plasma_insulin}
grid=-5:0.1:500

<DESIGN>
[ADMINISTRATION]
iv_glucose = {time=0, amount=21000, tinf=3, type=1 } ; 21g glucose intravenous
oral_glucose = {time=0, amount=70000, tinf = 4, type=2} ; 70g glucose oral solution
oral_meal = {time=0, amount=71000, tinf =4, type=3} ; meal with 140g carbohydrate

<RESULTS>
[GRAPHICS]
p1 = {y={venous_plasma_glucose}, ylabel='Plasma glucose concentration [mg/dL]', xlabel='Time [min]'}
p2 = {y={venous_plasma_insulin}, ylabel='Plasma insulin concentration [mU/L]', xlabel='Time [min]'}
Model exploration
After having loaded the project file in Mlxplore, and compiled using the blue arrow, the model can be explored.
Effect of the three glucose tolerance tests
According to the specifications, given in the <RESULT> section, the graphics display the plasma glucose and insulin concentrations, fro the three glucose tolerance tests. In the figure below, the intravenous glucose test is in orange, the oral glucose in blue and the mixed meal in green. In case of an oral ingestion, the glucose concentration in the blood rises progressively. For the same total amount of glucose, the appearance of glucose in the blood is slower in the case of a mixed meal, compared to a glucose solution:
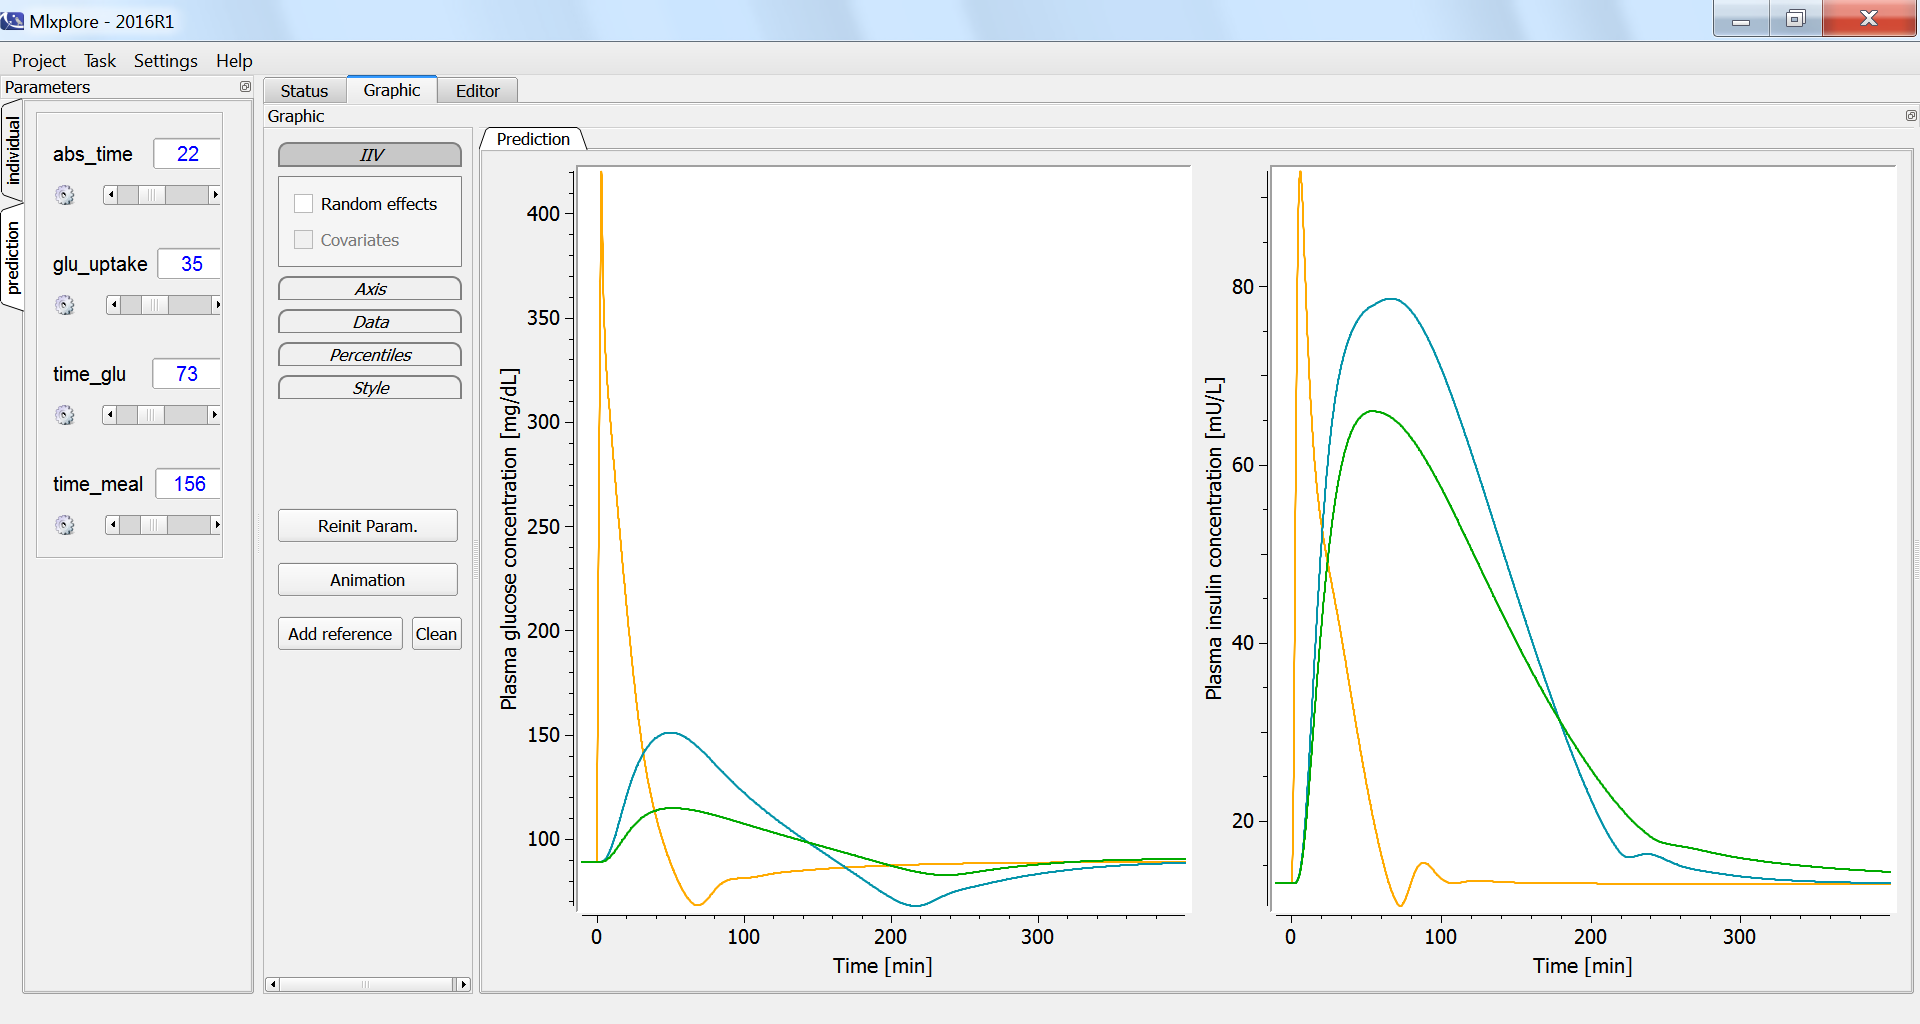
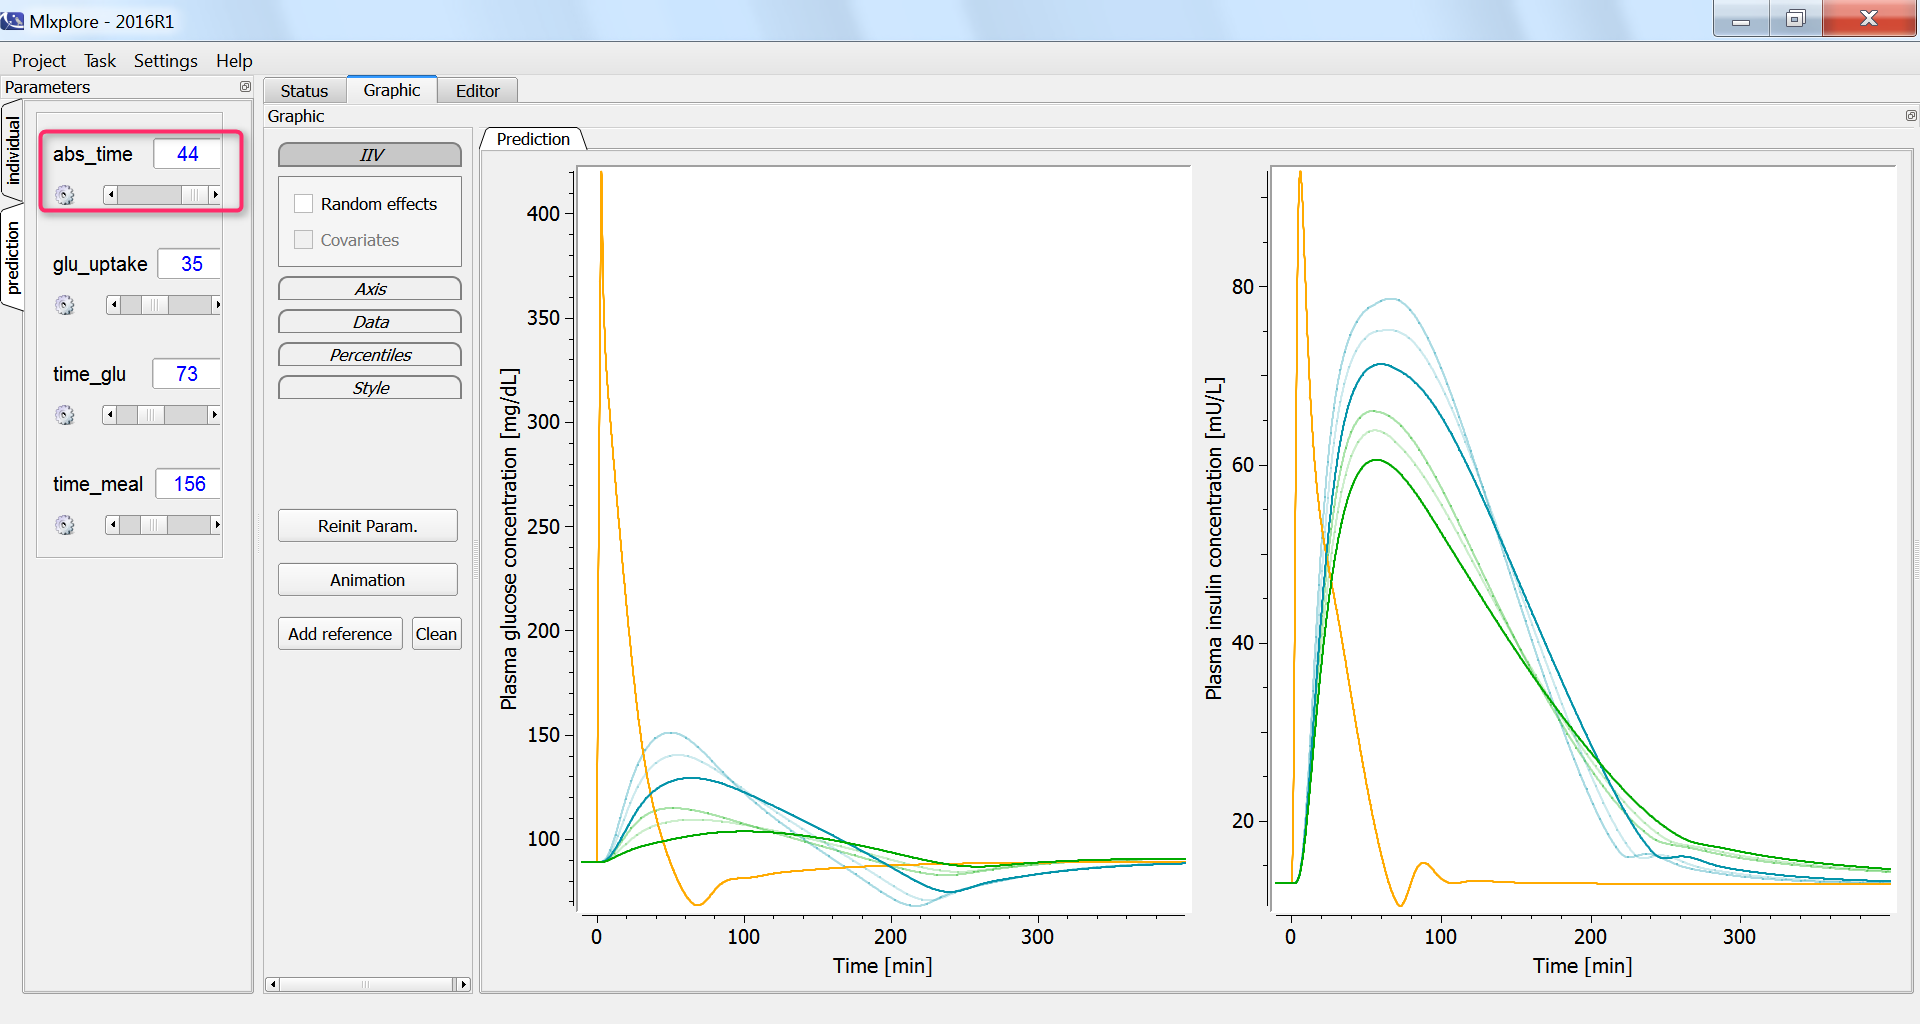
The influence of having a faster or slower characteristic time of absorption of glucose from the intestine into the blood (parameter abs_time) can be explored using the parameter slider:
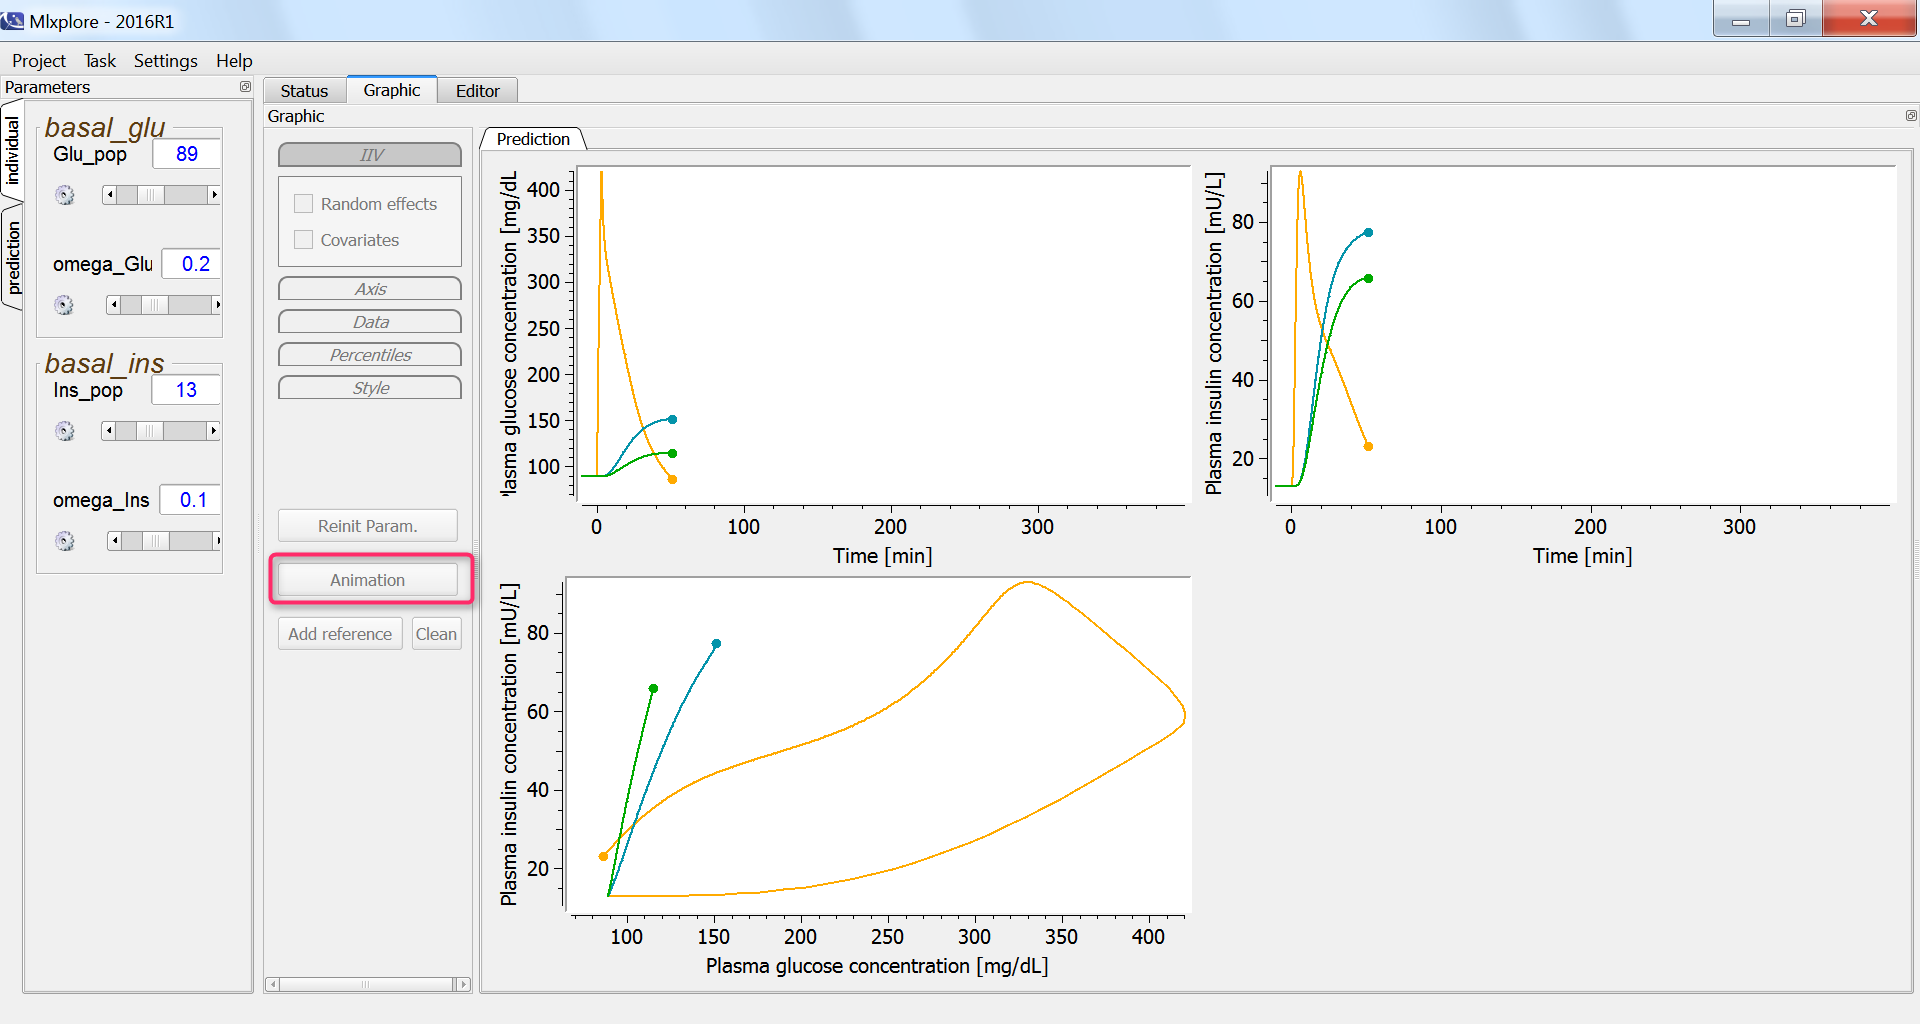
In all three cases, we expect that the glucose concentration increases first, triggering the increase in the insulin concentration. With the current display, this cannot be easily verified. We thus adapt the project file in order to output also the insulin concentration with respect to the glucose concentration, in the <RESULTS> section:
<RESULTS>
[GRAPHICS]
p1 = {y={venous_plasma_glucose}, ylabel='Plasma glucose concentration [mg/dL]', xlabel='Time [min]'}
p2 = {y={venous_plasma_insulin}, ylabel='Plasma insulin concentration [mU/L]', xlabel='Time [min]'}
p3 = {y={venous_plasma_insulin}, x={venous_plasma_glucose}, ylabel='Plasma insulin concentration [mU/L]',
xlabel='Plasma glucose concentration [mg/dL]'}
In the graphics, we can use the “animation” button to see how glucose and insulin evolve over time. The hysteresis appears clearly, with first the rise of glucose and then that of insulin:
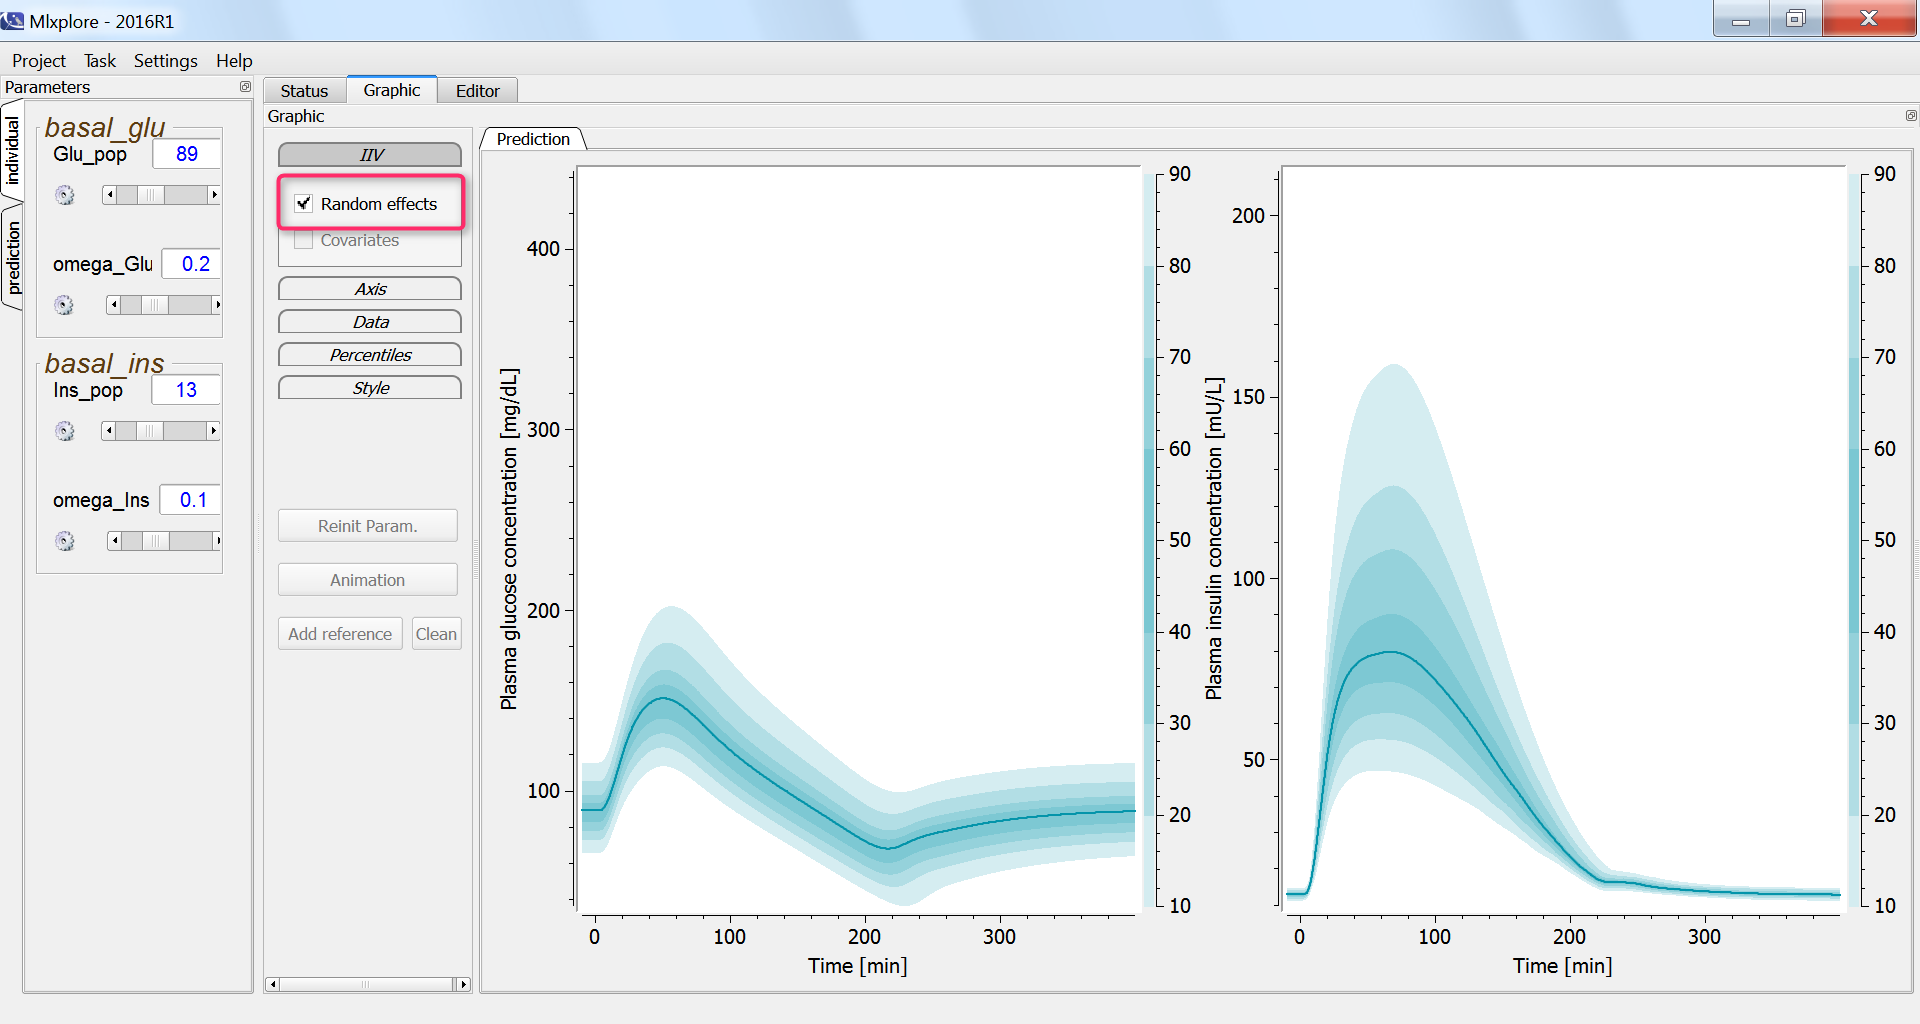
Finally, we assess the variability in the glucose and insulin concentrations after glucose uptake given that each individual has a slightly different basal glucose and insulin level:
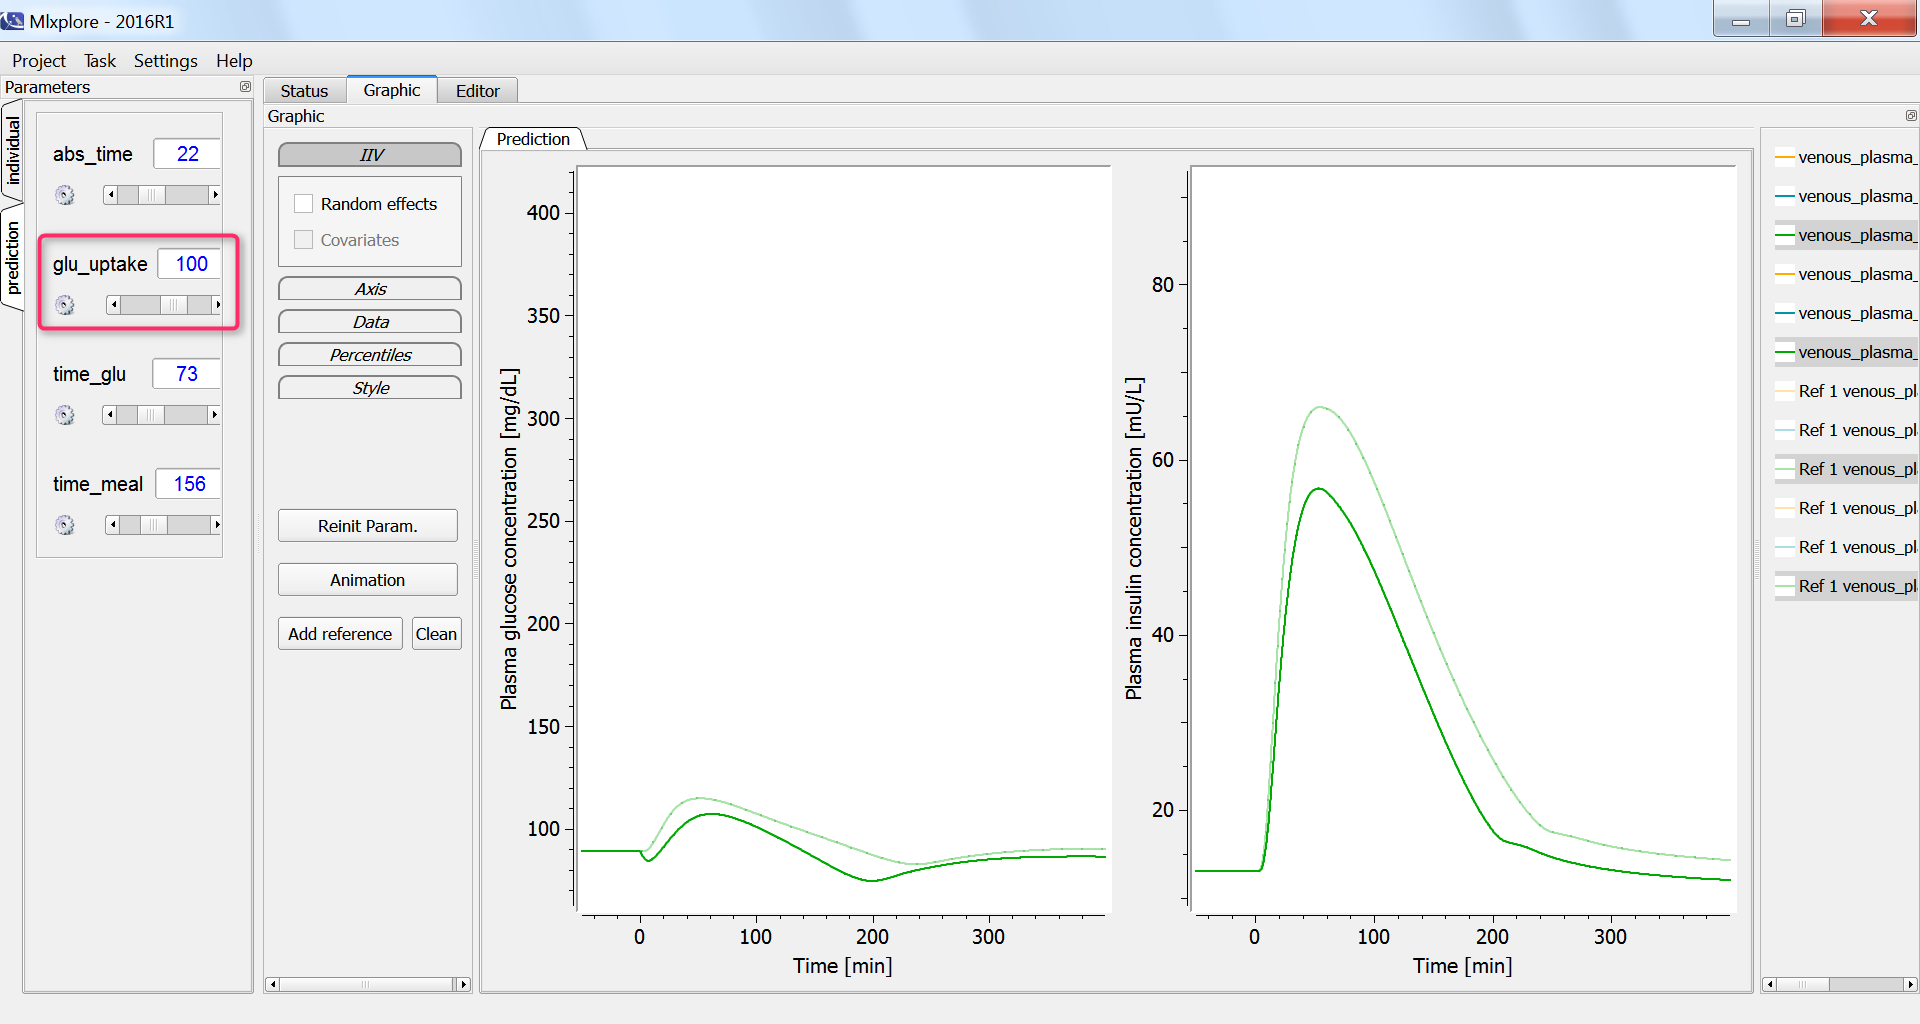
Effect of physical exercice
Next, we investigate the influence of physical exercice on the glucose concentration. During physical exercice, the glucose consumption by muscles increases. To capture this in the model, we increase the glucose uptake by the periphery compartment, which include muscles, from the initial 35 mg/min to 100 mg/min. As a consequence, the glucose and insulin concentrations increase less:
Conclusion
In this example a complex ODE-based PBPK model with 4 entities and 28 equations has been implemented. The real-time simulations permit to interactively explore the model behavior, even for large models.
In this case study, the effect of three glucose tolerance tests have been studied in conditions representing healthy humans. The model could be further adapted to simulate the expected response of diabetic individuals to the glucose tolerance tests.